junlincc opened a new issue #11790:
URL: https://github.com/apache/incubator-superset/issues/11790
To Reproduce Steps to reproduce the behavior: Go to explore Create time-series bar chart Add annotation layer Set y=constant e.g. `y=100` as formula 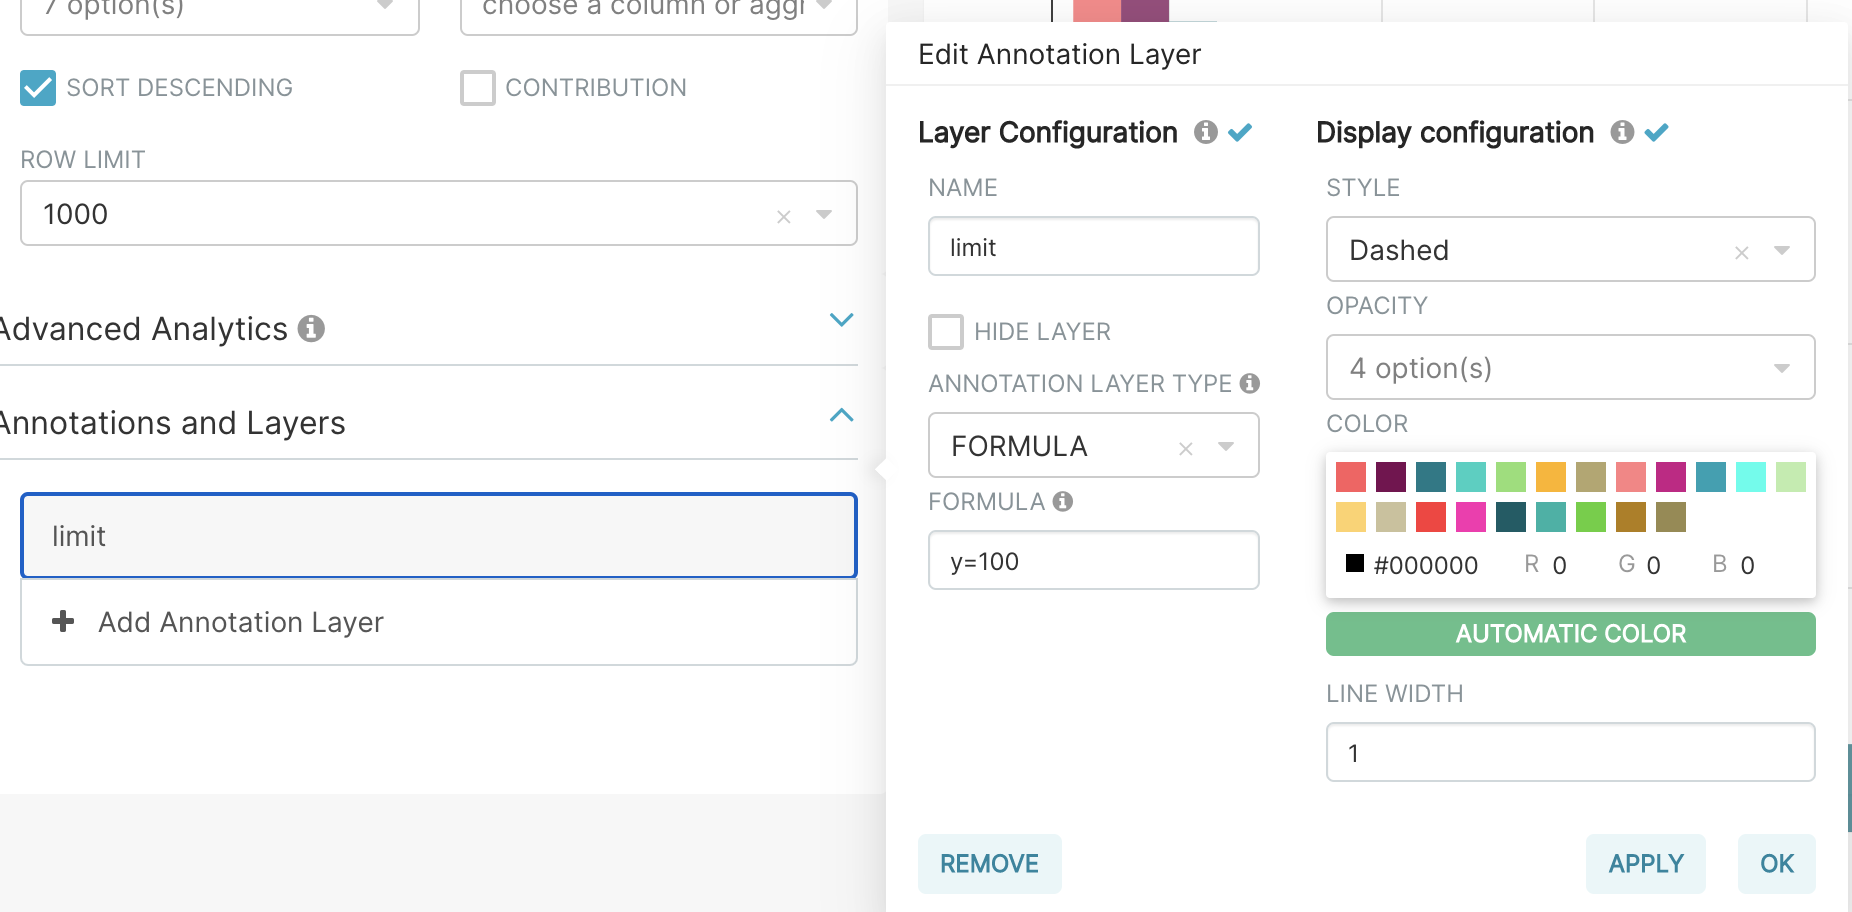 Expected behavior A horizontal line at y 100 Screenshots It adds a bar for each grouped bar instead. <img width="922" alt="second" src="https://user-images.githubusercontent.com/67837651/100050479-5bb47c80-2dce-11eb-870e-42504f92fcae.png";> cc: @kristw ---------------------------------------------------------------- This is an automated message from the Apache Git Service. To respond to the message, please log on to GitHub and use the URL above to go to the specific comment. For queries about this service, please contact Infrastructure at: [email protected] --------------------------------------------------------------------- To unsubscribe, e-mail: [email protected] For additional commands, e-mail: [email protected]