zuzana-vej opened a new issue #12643:
URL: https://github.com/apache/superset/issues/12643
When a user clicks on "Toggle chart description", the description gets displayed bellow the chart title, and the chart shifts downwards, resulting in the bottom of the chart (the x axis and legend) overflowing out of the chart area ### Expected results Chart doesn't overflows ### Actual results Chart overflows #### Screenshots Before "Toggle Chart description" 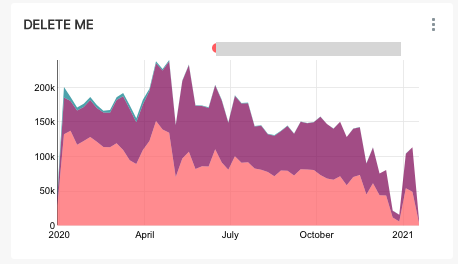 After "Toggle Chart description" 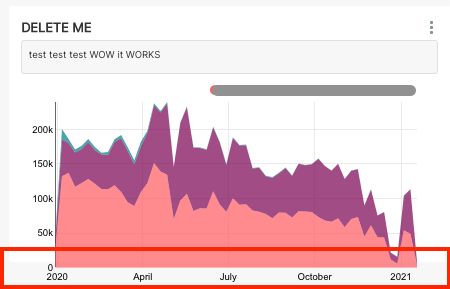 #### How to reproduce the bug 1. Go to Dashboard 2. Click on '...' on a chart which has a description (can be added in chart explore edit properties) 3. Click on "Toggle Chart description" 4. See issue ### Environment latest master ### Checklist Make sure to follow these steps before submitting your issue - thank you! - [x] I have checked the superset logs for python stacktraces and included it here as text if there are any. - [x] I have reproduced the issue with at least the latest released version of superset. - [ ] I have checked the issue tracker for the same issue and I haven't found one similar. ---------------------------------------------------------------- This is an automated message from the Apache Git Service. To respond to the message, please log on to GitHub and use the URL above to go to the specific comment. For queries about this service, please contact Infrastructure at: [email protected] --------------------------------------------------------------------- To unsubscribe, e-mail: [email protected] For additional commands, e-mail: [email protected]