zuzana-vej opened a new issue #13040:
URL: https://github.com/apache/superset/issues/13040
**Is your feature request related to a problem? Please describe.** Currently when user selects monthly or weekly time grain in Explore, the X axis on the chart still displays all the days (if there is space for it - depending on time period overall selected). There is no way to change this currently in the Customize tab. **Describe the solution you'd like** If monthly time grain is selected, the X axis on the chart should just display months (January, February etc.) based on what formatting user selects in the Customize tab. If weekly time grain is selected, the X axis on the chart should just display weeks. (e.g. date of the first day (Monday) in each week) **Describe alternatives you've considered** other option is to let user configure this in the "customize tab" **Additional context** See two examples of the problem. My time grain is weekly, but I see all the days bellow, even though chart values are populated weekly.  My time grain is monthly but I see again all the days on X axis. 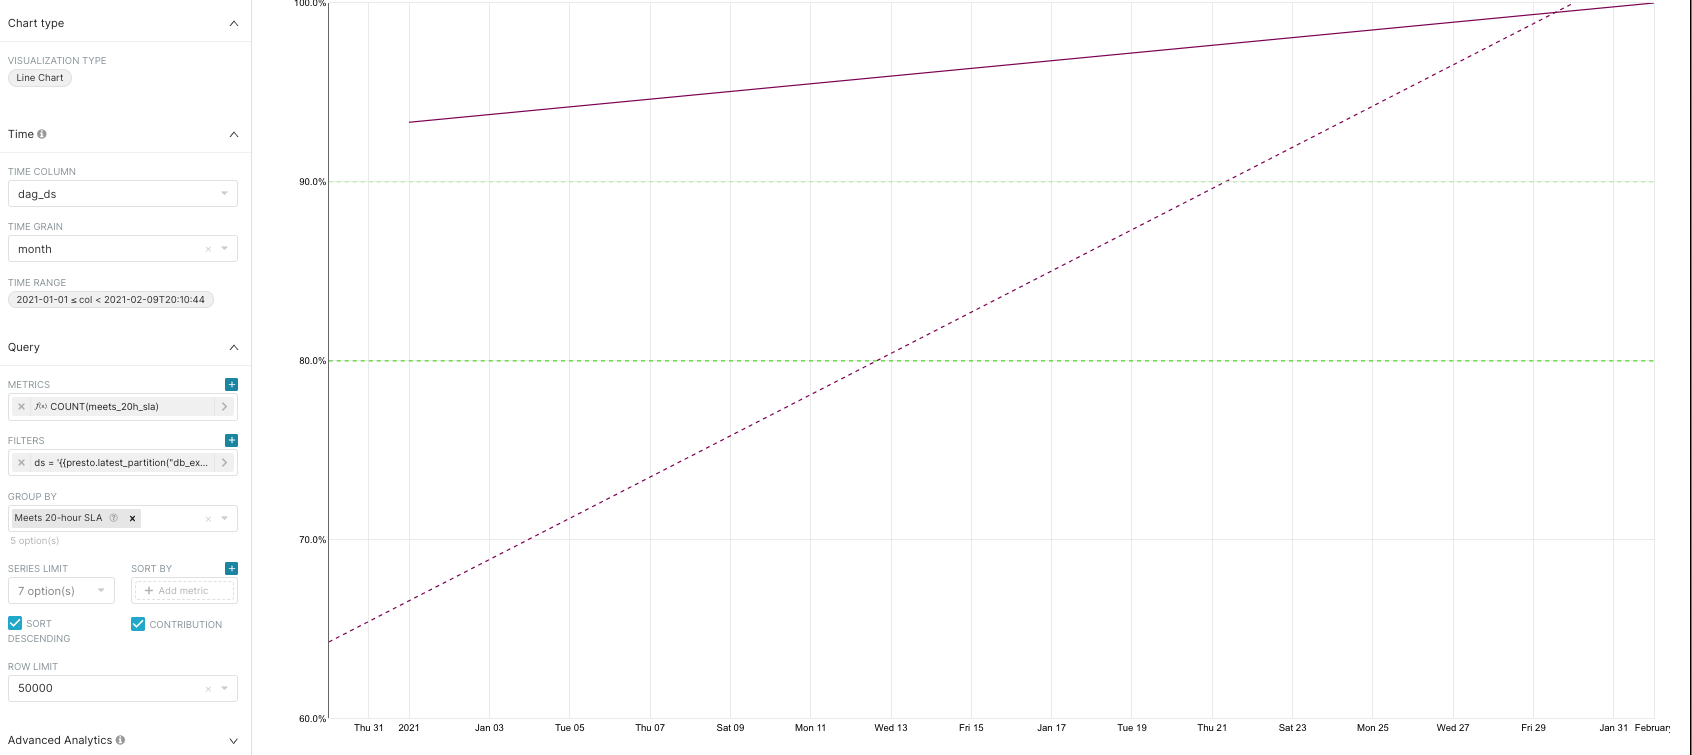 ---------------------------------------------------------------- This is an automated message from the Apache Git Service. To respond to the message, please log on to GitHub and use the URL above to go to the specific comment. For queries about this service, please contact Infrastructure at: [email protected] --------------------------------------------------------------------- To unsubscribe, e-mail: [email protected] For additional commands, e-mail: [email protected]