leocape opened a new issue #13146:
URL: https://github.com/apache/superset/issues/13146
**Is your feature request related to a problem? Please describe.** When looking at a line chart, it's difficult to see what the precise values of the data points are - currently we need to gauge their approximate value by eyeballing the x and y axis, which is straining and not accurate. Especially for quick glances / reporting in meetings. **Describe the solution you'd like** To have the values displayed next to the data points themselves, so that we can see the precise values without having to approximate them by eyeballing the axes. This should be optional, and can be shown/hid in the Customize menu **Describe alternatives you've considered** This is really the only approach **Additional context** As is: 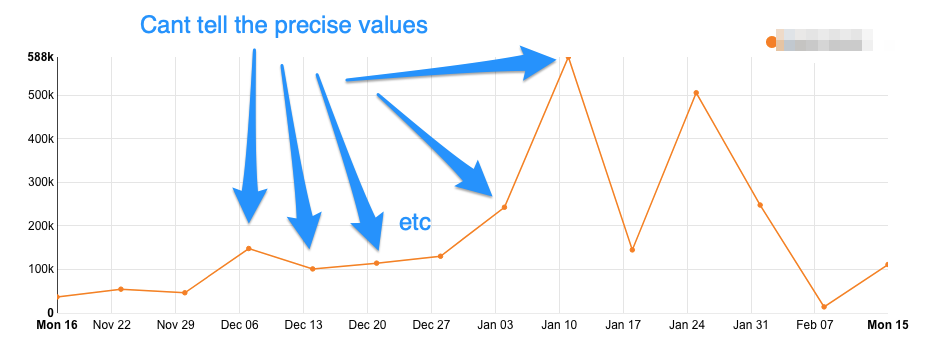 To be: 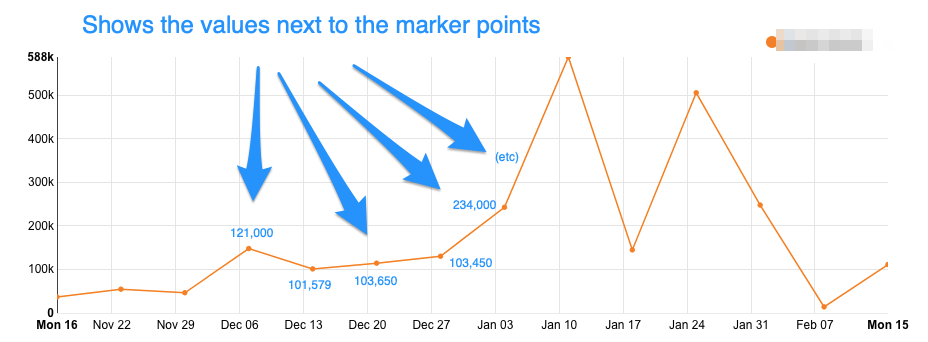 Example of how Looker does it: 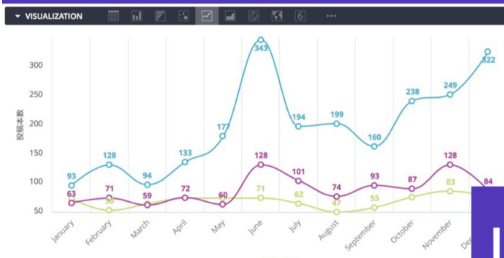 Where the option to show / hide might be in the UI: 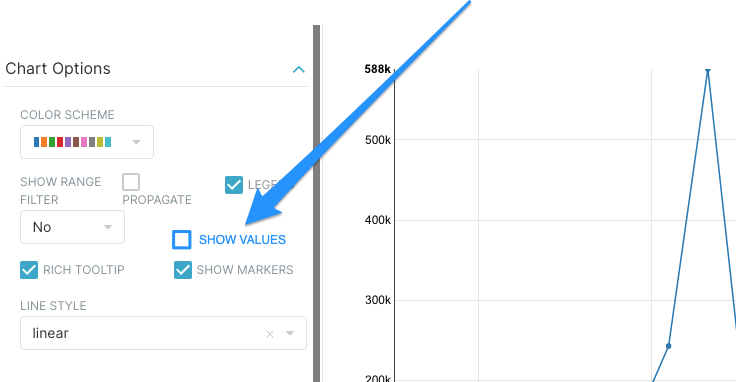 ---------------------------------------------------------------- This is an automated message from the Apache Git Service. To respond to the message, please log on to GitHub and use the URL above to go to the specific comment. For queries about this service, please contact Infrastructure at: [email protected] --------------------------------------------------------------------- To unsubscribe, e-mail: [email protected] For additional commands, e-mail: [email protected]