mikekytyzov opened a new issue #13312:
URL: https://github.com/apache/superset/issues/13312
A clear and concise description of what the bug is. I have a metric called Total users. I want to make a line chart with this metric by day, but display only 5 top results per day. So, i select `series` input to 5, but it doesnt work, all results still displayed. Screen is attached ### Expected results Series is applied by each time granula. ### Actual results Series input doesnt make any affect #### Screenshots 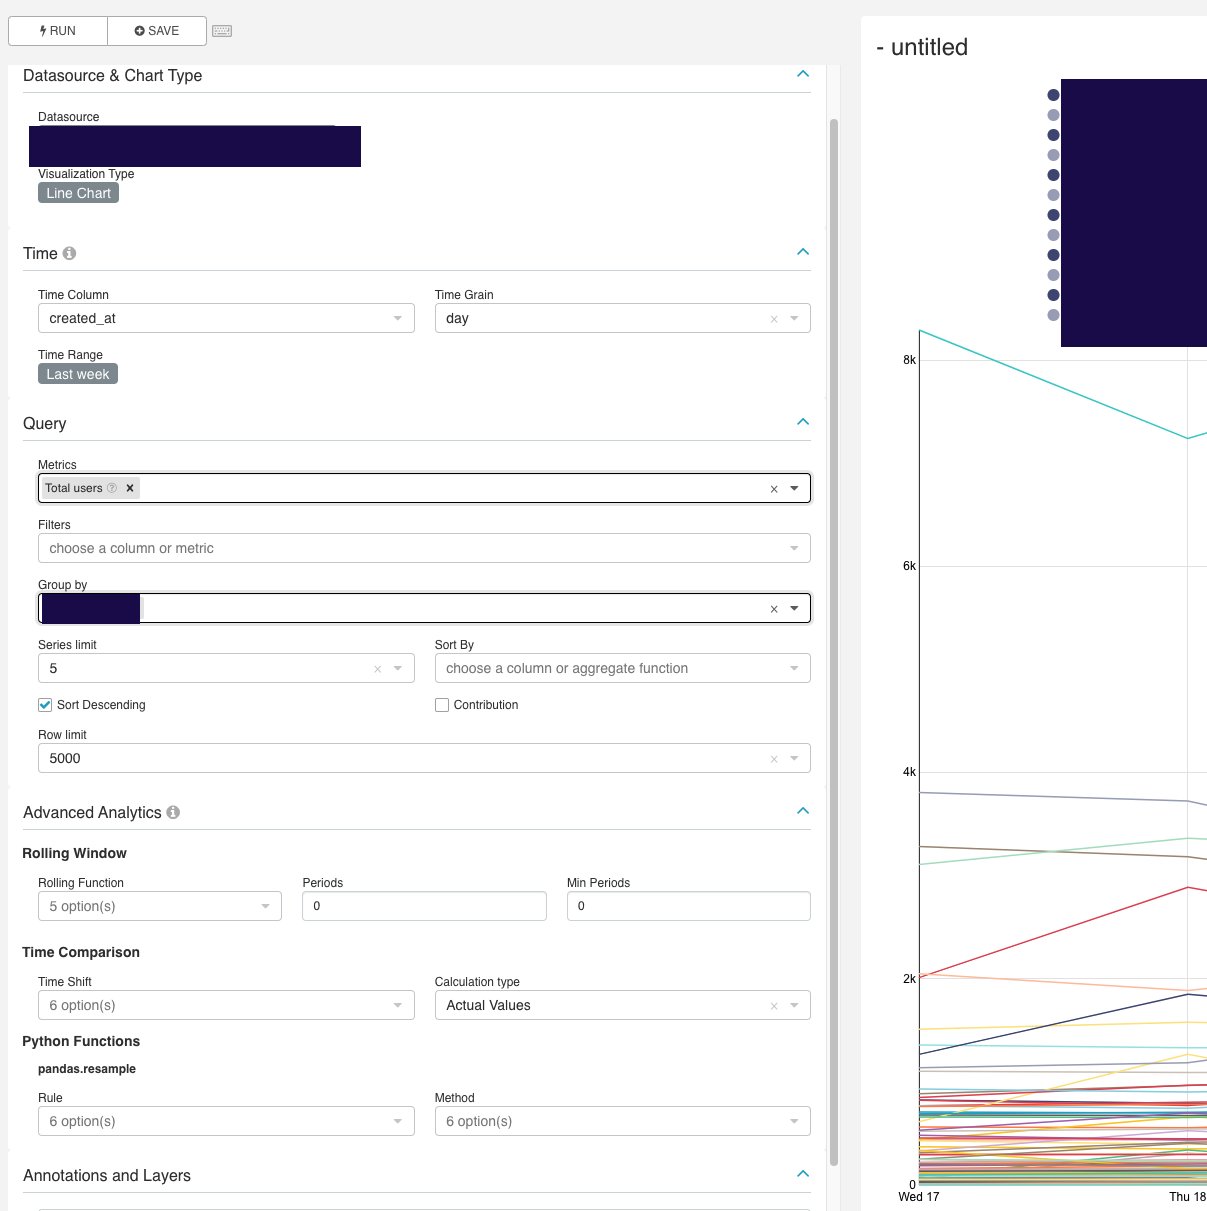 #### How to reproduce the bug 1. Try create line chart with a lot of data 2. Select series to 5 3. See that series doesnt make any affect ### Environment (please complete the following information): - superset version: `0.34.1` - python version: `3.6.12` - node.js version: `node -v` ---------------------------------------------------------------- This is an automated message from the Apache Git Service. To respond to the message, please log on to GitHub and use the URL above to go to the specific comment. For queries about this service, please contact Infrastructure at: [email protected] --------------------------------------------------------------------- To unsubscribe, e-mail: [email protected] For additional commands, e-mail: [email protected]