zuzana-vej opened a new issue #13717:
URL: https://github.com/apache/superset/issues/13717
**Is your feature request related to a problem? Please describe.** Visually, higher cardinality (6+) dimensions are difficult to parse and pose a challenge for data consumers in attempting to interpret what metrics increased and/or decreased for a time-series line chart or bar chart with many series. For data/chart producers, high-cardinality dimensions make it a challenge to display a legend (as it consumes too much real estate and ceases to be useful as an interactive visual exploration tool). See bar chart below. Moreover, when setting a series limit the total value of the metric for the time period is affected and reflects only the top x series limited to - leading to confusion for users about what is an accurate total. **Describe the solution you'd like** Time-series Superset charts (line & bar) would include an ability to group a dimension by top-N values (where N is set by the chart creator), of this dimension (this is most meaningful when ordered by metric for the biggest buckets of the metric cut by this dimension). The remaining dimension values would be aggregated in a single ‘Other’ grouping. This could be complicated by several dimension cuts to group by, but would be a modification and enhancement of the series limit feature. This type of feature is also a standard in BI tools such as Tableau. Example: 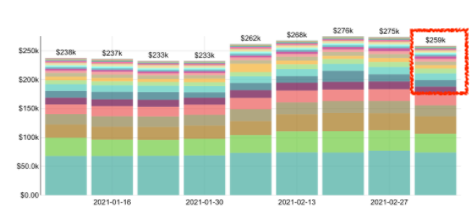 -- This is an automated message from the Apache Git Service. To respond to the message, please log on to GitHub and use the URL above to go to the specific comment. For queries about this service, please contact Infrastructure at: [email protected] --------------------------------------------------------------------- To unsubscribe, e-mail: [email protected] For additional commands, e-mail: [email protected]