ankargren commented on issue #13490:
URL: https://github.com/apache/superset/issues/13490#issuecomment-815540942
I have the same issue, but with another type of plot. I'm posting here as my guess is that they are related to the same problem, but if you'd prefer that I open up a new issue just let me know! To reproduce the problem: - Create a chart using the wb_health_population example data - Create a time-series chart as follows and save to a new dashboard: 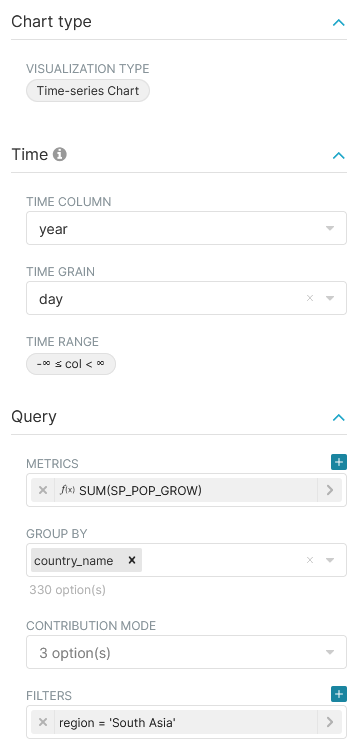 - Create a line chart with the exact same specifications and save to the same dashboard - Expected output (logged in, as admin in my case) is: 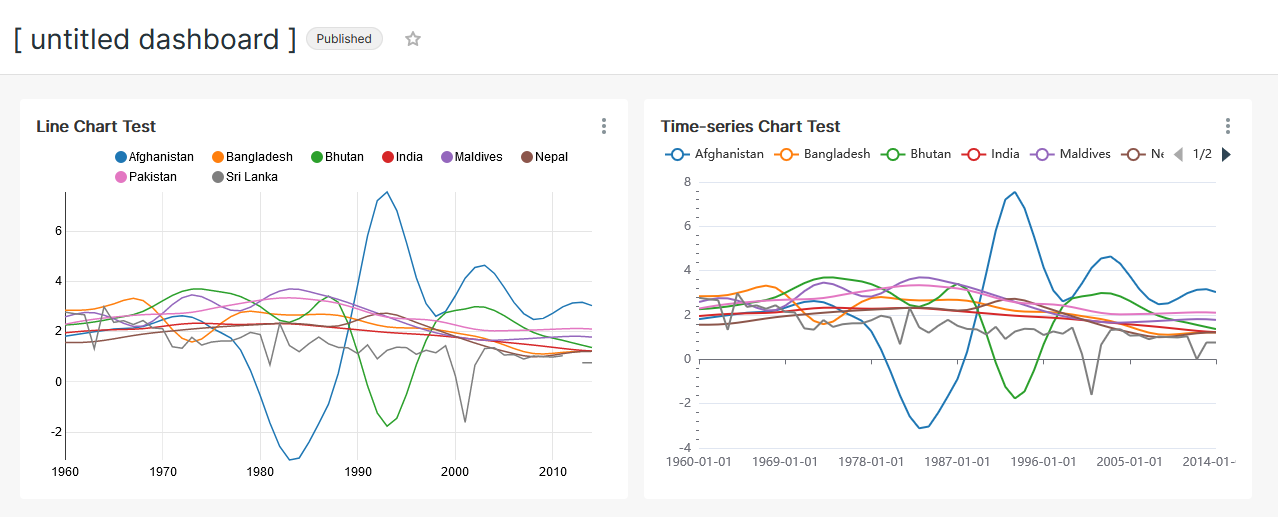 - Now opening up a fresh browser and visiting the dashboard without logging in, I get: 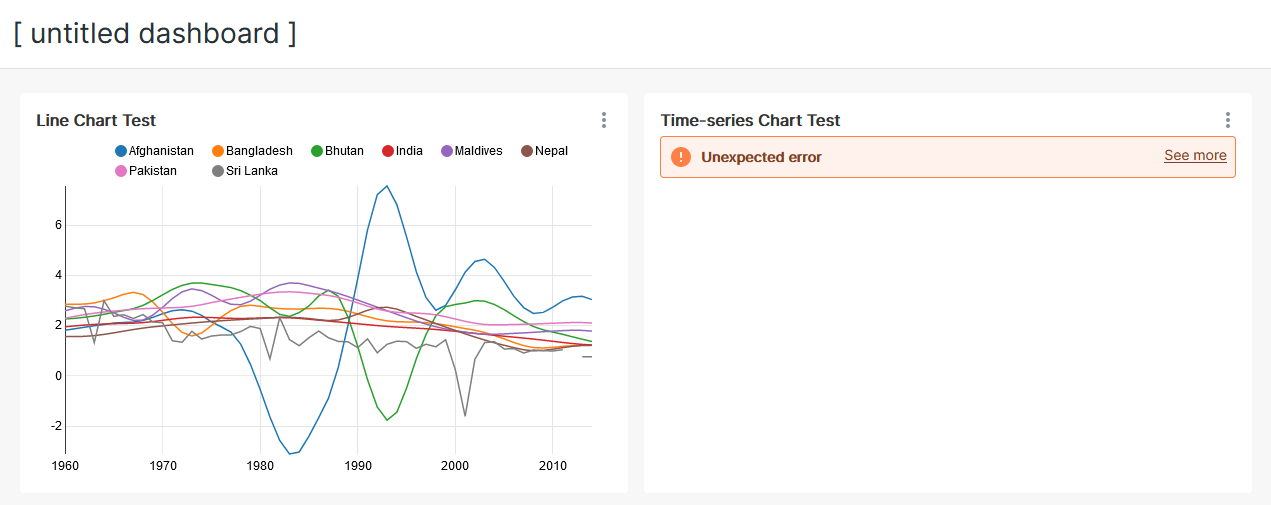 My expectation here would be that both should be visible. Toggling "See more" gives no additional information as the box is empty. The public role I use is configured as follows: 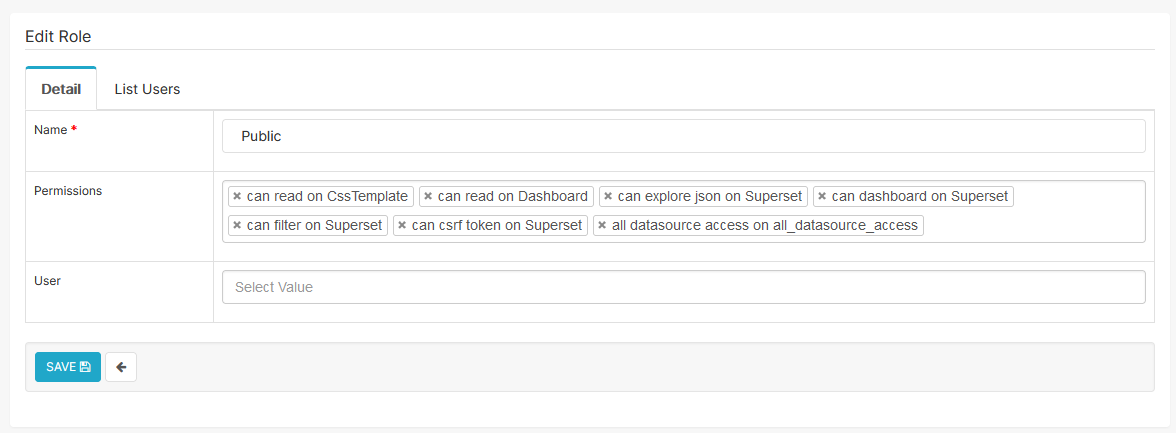 -- This is an automated message from the Apache Git Service. To respond to the message, please log on to GitHub and use the URL above to go to the specific comment. For queries about this service, please contact Infrastructure at: [email protected] --------------------------------------------------------------------- To unsubscribe, e-mail: [email protected] For additional commands, e-mail: [email protected]