On Fri, 2016-02-05 at 15:49 +0100, Simone Mainardi wrote:
> Brian,
>
> if you go to the interface stats page you can see bandwidth usage
> over
> time.
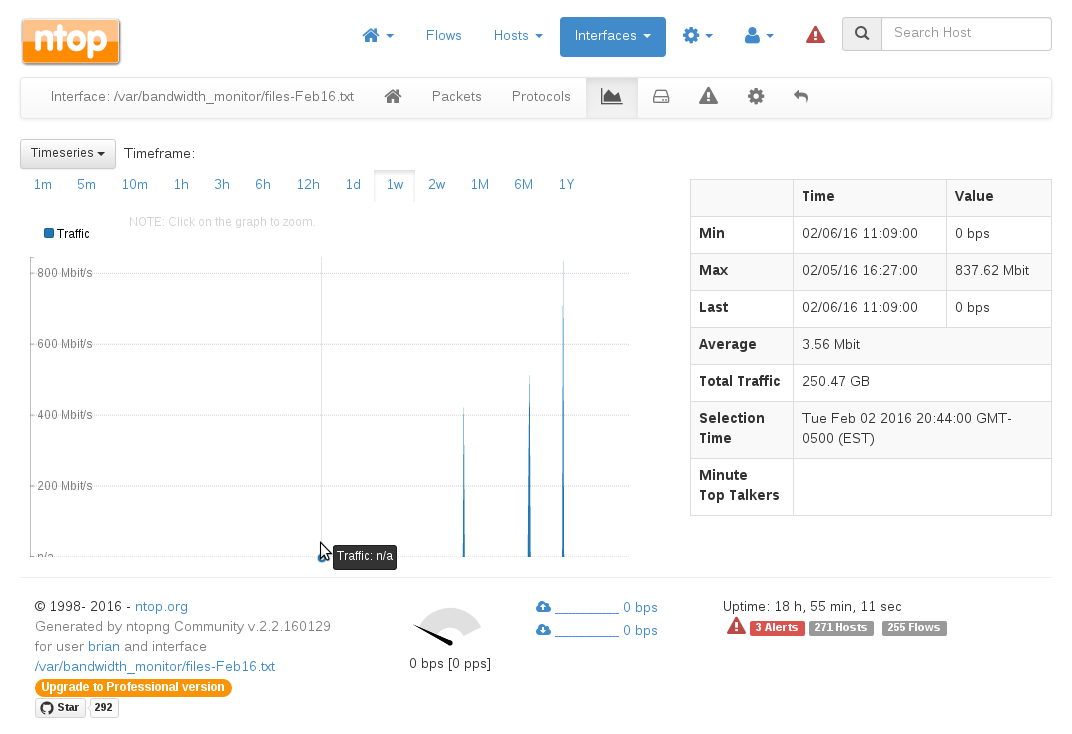
Hrm.  It does not look at all correct.  See the screenshot here:

http://www.interlinx.bc.ca/~brian/ntopng-interface.png

There is no way that interface is ever idle so where I have the mouse
hovering and it says "Traffic: n/a" just isn't right.

>  In addition, if you hover the chart with the mouse, you will see
> minute top-talkers on the right.

That field never has any value in it, even when I hover over one of the
3 "spikes".

Perhaps these problems are because it is a pcap file (list) I am
reading rather than a real interface because when I try the same thing
on a real interface, things look more like you describe them.

But there is no reason things should act differently just because it's
a pcap file.  A pcap file should just build an instant history
equivalent to what watching on an interface live would have done over
the same time frame.

>  You can chart per protocol-statistics as
> well.

But not per host, right?

> Also note that we are improving the drilling down of this kind of
> information. It will be available soon.

Awesome.

Cheers,
b.
![]() signature.asc
signature.asc
Description: This is a digitally signed message part
_______________________________________________
Ntop mailing list
[email protected]
http://listgateway.unipi.it/mailman/listinfo/ntop