Hello,

I'm a little bit confused regarding the graphs of "Info about host".
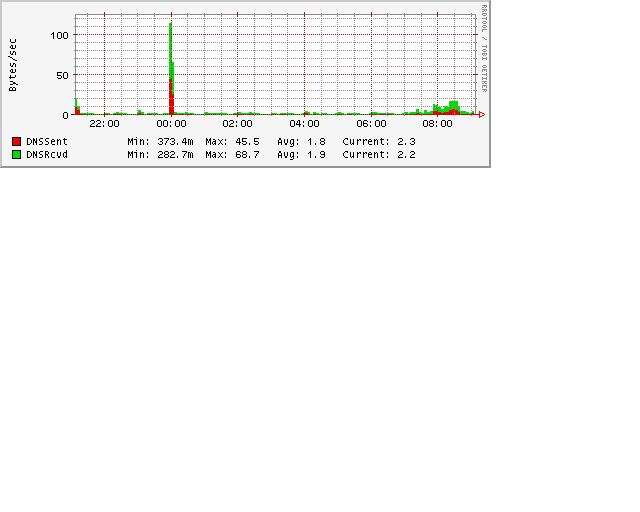
I attached a sample just to use in my questions.

1. Which values (Min, Max, Avg, Curr) are used to compose this graphs ?

2. What means the letter "m" in the Min values ?

3. Looking at time 00:00, I understood that the green bar went to
approximately 115. This is the result of the sum btw green and red Max
values, is it correct ? When there is a much high peak value like this case
(00:00) the visualization of the average values is not good. Is there some
option to change this behavior to show the average and not the max values?

Best regards,
![]() sample.PNG
sample.PNG
Description: PNG image
_______________________________________________
Ntop mailing list
[email protected]
http://listgateway.unipi.it/mailman/listinfo/ntop