Hi Wakan,

nice discussion, thank you.
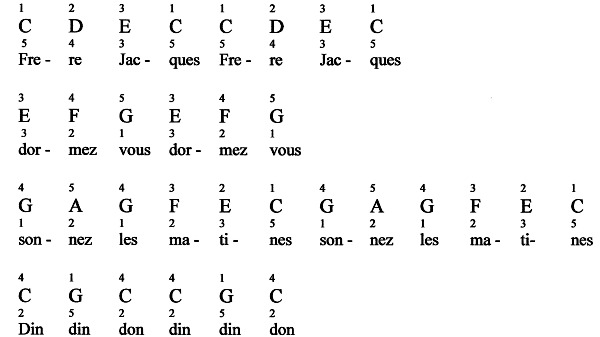
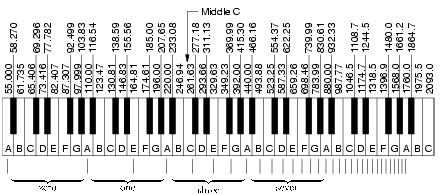
I agree with Raf on importance of correct metrics, I'd like to suggest
using anomaly detection, a HTM implicit feature, as a way to tell where &
how much the prediction were off.

For some results, you can refer to NAB https://github.com/numenta/NAB -
real world, streaming datasets; and
https://github.com/breznak/neural.benchmark for synthetic.

Cheers,
Mark

On Wed, Jan 13, 2016 at 12:34 PM, Raf <[email protected]> wrote:

> As you can see, that little bugger of my neighbour's kid, makes two
>> mistakes: in the first case the error according to the RMSE/MSE/MAE
>> wouldn't be that a big error (440.00-348.23 = 91.77) and the latter case,
>> instead, would represent for the mlearning system (in this case the kid) a
>> MASSIVE error (698.46-440.00 = 258.76).
>>
> I realized that I made a mistake in the second calculation which should be
> 698.46-348.23 = 350.23 (which is even worst!).
>
>
> On 13/01/2016 11:26, Raf wrote:
>
>> Hi Wakan,
>>
>> in the case of a classification task (when you have a dataset with
>> already defined "labels") the RMSE/MSE/MAE would be calculated (at least
>> with other ml models) between the probability predicted for the right class
>> (0.00, 1.00) vs the real class (0.00, 1.00). That is why, for this peculiar
>> job I wouldn't advice this way of estimate the error. Even using the price
>> as a loss function, though, for a classification task... I suppose that
>> wouldn't perform well in the real world (imho).
>>
>> Nonetheless, even in the case of a pure regression task (where you would
>> try to predict the next price, for example) and even calculating the
>> RMSE/MSE/MAE as a cost function between prices... it wouldn't be useful in
>> real life (imho). Why? Because it wouldn't take into account non-linear
>> real life scenarios like possible fees and commissions, price slippages and
>> lack of liquidity.
>>
>> What you really want is to know if right now is a good moment to "do
>> nothing", "buy" or "sell" - not just the price change.
>>
>> I'll try to make an example (sorry if I raise too many trading concepts,
>> but it actually fits the topic in my opinion).
>>
>> - It is 12pm. The current price of something is 1205.00 (something/USD).
>> The prediction of the price for the next three hours (15pm) is  1155.00: it
>> is lower, but it is not worth the trade... for now.
>> -One hour passes (it is 13pm), current real price is 1170.00. Let's
>> imagine that the real price in three hours from now will be a lot lower
>> than the actual price: 900.00. The predicted price for the next three hours
>> is 905.00 : wonderful prediction! It is a lot lower than the current price,
>> so we sell.
>>
>> But.... because it is happening during some news (everyday at 15.00 CET
>> or 16.00 CET there is going to be some news that shakes that particular
>> asset and the machine learning system understood that), your bank decides
>> to increase the spread (or the commissions) in order to filter orders and
>> giving precedence to bigger investments at the expense of smaller ones.
>> Also, because there is huge volatility, your order cannot be processed at
>> the price you hoped to sell because your request to "sell" doesn't match
>> any other "buy" action for that price: this means your order is processed
>> at a price of 960.00 instead of the original price (1170.00). Furthermore,
>> due to the network high traffic at that time, you can't promptly process
>> the order, slipping of a couple of mseconds that though turn into another
>> price slippage. This means that between the widened spread/commissions and
>> this market "slippage", your profit is almost non-existent and you could
>> probably even end up losing money.
>>
>> Now, I remind us the original question I've been asking to my mlearning
>> system: "is it a good moment for buying, selling, or doing nothing?".
>>
>> Of course a human mind would prefer not to enter into volatility (at
>> 13pm) - instead, some sort of "blind" mlearning system that takes into
>> account only the price change would be tempted to enter exactly in that
>> moment. This is not what we wanted to start with.
>>
>>
>> I did this example just because I'm familiar with these kinds of scenario
>> but probably this wasn't the best choice for NuPIC.
>>
>> I'll make another example which, in my opinion, fits better a neocortical
>> algorithm. Let's imagine now that my neighbour has a kid that is learning
>> piano (this is actually happening :-) ).
>> He is learning this[1] song: "Frère Jacques". When I'm working and I
>> listen to him through my wall, my brain (see HTM paper which explains that
>> brilliantly) expects this exact sequence[2]: C - D - E - C - C - D - E - C
>> | E - F  (...) . Now, when the kid learns, of course he makes mistakes
>> (that's how we learn after all!).
>> When he plays some note wrong (that is not in the above sequence) he,
>> actually "we" :), understand that he was wrong because my TemporalMultiStep
>> Prediction detected an "anomaly" (trying to use NuPIC jargon here).
>> If his brain had to consider a "brutal" :) RMSE or MAE he should take the
>> frequencies of the notes in the piano[3] and subtracting the expected
>> (real) value from the played value.
>>
>> EXPECTED VALUES (considering the middle C):
>> 261.63 Hz - 293.66 Hz - 329.63 Hz - 261.63 Hz - 261.63 Hz - 293.66 Hz -
>> 329.63 Hz - 261.63 Hz - | - 329.63 Hz - 348.23 Hz - ....
>>
>> PLAYED VALUES (Error 1):
>> 261.63 Hz - 293.66 Hz - 329.63 Hz - 261.63 Hz - 261.63 Hz - 293.66 Hz -
>> 329.63 Hz - 261.63 Hz - | - 329.63 Hz - 444.00 Hz  (A) ....
>>
>> PLAYED VALUES (Error 2):
>> 261.63 Hz - 293.66 Hz - 329.63 Hz - 261.63 Hz - 261.63 Hz - 293.66 Hz -
>> 329.63 Hz - 261.63 Hz - | - 329.63 Hz - 698.46 Hz  (NEXT OCTAVE F insted of
>> current octave F) ....
>>
>>
>> As you can see, that little bugger of my neighbour's kid, makes two
>> mistakes: in the first case the error according to the RMSE/MSE/MAE
>> wouldn't be that a big error (440.00-348.23 = 91.77) and the latter case,
>> instead, would represent for the mlearning system (in this case the kid) a
>> MASSIVE error (698.46-440.00 = 258.76).
>>
>> In the reality, though, it is much "less-horrible" to listen to the
>> second error (which is at least the same note, although of the next octave)
>> than the first error (which is a totally different note).
>>
>> If the kid had to learn using RMSE/MSE/MAE I think he wouldn't been able
>> to distinguish between "little" and "massive" errors thus he couldn't learn
>> to play the piano.
>>
>>
>> At the end, what I wanted to stress, to give you my opinion, is that the
>> choice of the loss function/metrics is very very very important for
>> defining the correct learning method of any machine learning system.
>>
>> My two cents :)
>>
>> Raf
>>
>>
>> [1]: https://www.youtube.com/watch?v=eYtuOYABwes
>> [2]: http://www.true-piano-lessons.com/images/FrerejacquesinCtab.jpg
>> [3]: http://amath.colorado.edu/pub/matlab/music/frequencies.jpg
>>
>>
>>
>>
>>
>> On 13/01/2016 10:24, Wakan Tanka wrote:
>>
>>> Thank you Raf,
>>>
>>> why do you think that you would not notice difference between little and
>>> big mistake? I suppose that little mistakes will have lower square and the
>>> big will have bigger square. When you will then average all values which
>>> you have obtained such way then it is possible that one big mistake will
>>> drastically change the final score, but in general this is what you want
>>> isn't it? No matter if you were predicting lot of small mistakes or one big
>>> mistake, if the amount of money you have lost is the same.
>>>
>>> PS: I suppose using some other metrics (some kind of clustering or maybe
>>> more simple method using just basic histograms) it should be possible to
>>> filter just those big mistakes
>>>
>>> am I wrong?
>>>
>>>
>>> On 01/13/2016 08:50 AM, Raf wrote:
>>>
>>>> Hello Wakan.
>>>>
>>>> This is a huge point you are making and defining a loss function can
>>>> completely change the validity of a ML algo.
>>>>
>>>> Depending on your task (regression, classification) I strongly suggest
>>>> you to create your own Metrics[1]: this, imho, could have a big impact
>>>> on how the HTM region processes the data - it literally changes the
>>>> "learning goal".
>>>>
>>>> I'll try to clarify what I mean with a general classification example
>>>> not strictly linked to NuPIC.
>>>> Let's imagine I've a simple task of time series classification that's
>>>> maybe a bit unrealistic but it'll do the job.
>>>> I'm receiving oil prices and I'd like to know if now is the right moment
>>>> to  perform no action (label 0), to "buy" (label 1) or to "sell" (label
>>>> 2). The prediction obtained by the algo would consist of the probability
>>>> for each label; as an example: label 0 = 0.12 (12%), label 1 = 0.70
>>>> (70%), label 2 = 0.18 (18%.
>>>> Now, if I just evaluated the error using the distance of the predicted
>>>> value from the real value in terms of RMSE I would not notice (and most
>>>> of all I wouldn't let my ML system notice) the subtle differences
>>>> between a little mistake (the action is wrong and the price difference
>>>> is not that big) and a big mistake (the action is wrong again but the
>>>> price difference is huge this time). In this case, for example, using as
>>>> a loss function the outcome of the trade in terms of money if we
>>>> performed the trade for real (including fees and commissions) it could,
>>>> imho, give you a better overall learning process that is more useful in
>>>> the real world.
>>>> Of course, this has nothing to do with NuPIC per se but I suppose it is
>>>> common in basically all the ML algos you can think of.
>>>>
>>>> Raf
>>>> [1]
>>>>
>>>> https://github.com/numenta/nupic/blob/master/src/nupic/frameworks/opf/metrics.py
>>>>
>>>>
>>>>
>>>> On 13/01/2016 02:19, Wakan Tanka wrote:
>>>>
>>>>> Hello NuPIC,
>>>>>
>>>>> How do you evaluate a correctness and accurancy of a prediction? Or if
>>>>> you have multiple predictions for same data how do you compare which
>>>>> prediction was more accurate? I've seen that there is NAB [1] but to
>>>>> be honest I did not get deep into so I do not know if it might help or
>>>>> not. AFAIK when you want to do such things the correlation should work
>>>>> fine, in this case correlation between original and predicted data.
>>>>> But correlation works only when you have linear data, it would not
>>>>> work e.g. on hotgym example where you have repeating cycles, peaks,
>>>>> maybe random events in particular days etc. So my intuitive approach
>>>>> was to calculate absolute difference [2] of original and predicted
>>>>> value and then calculate mean of those values. The lower the mean is
>>>>> the better the prediction is. Then I've realized that there is
>>>>> standard deviation [3] which can be calculated from those absolute
>>>>> differences. Next step would be pick up all values which have absolute
>>>>> differences of original and predicted value:
>>>>> 1. above  mean + standard deviation
>>>>> 2. bellow mean - standard deviation
>>>>>
>>>>> This should give me an overview of how many values falls in this
>>>>> interval and how many is doesn't. The dataset where more values falls
>>>>> in the interval is dataset with better prediction.
>>>>>
>>>>> Does this make sense?
>>>>>
>>>>>
>>>>>
>>>>>
>>>>> [1]
>>>>>
>>>>> http://numenta.com/blog/nab-a-benchmark-for-streaming-anomaly-detection.html
>>>>>
>>>>> [2] https://en.wikipedia.org/wiki/Absolute_difference
>>>>> [3] http://www.mathsisfun.com/data/standard-deviation.html
>>>>>
>>>>>
>>>>>
>>>>
>>>
>>>
>>>
>>
> --
> Raf
>
> www.madraf.com/algotrading
> reply to: [email protected]
> skype: algotrading_madraf
>
>
>


--
Marek Otahal :o)