--- In obrolan-bandar@yahoogroups.com, Andre Andre <andre...@...> wrote:
>
> Crita riwayat hidup dia maksud saya om bukan cerita dia brantem ama
institusi...
>
>
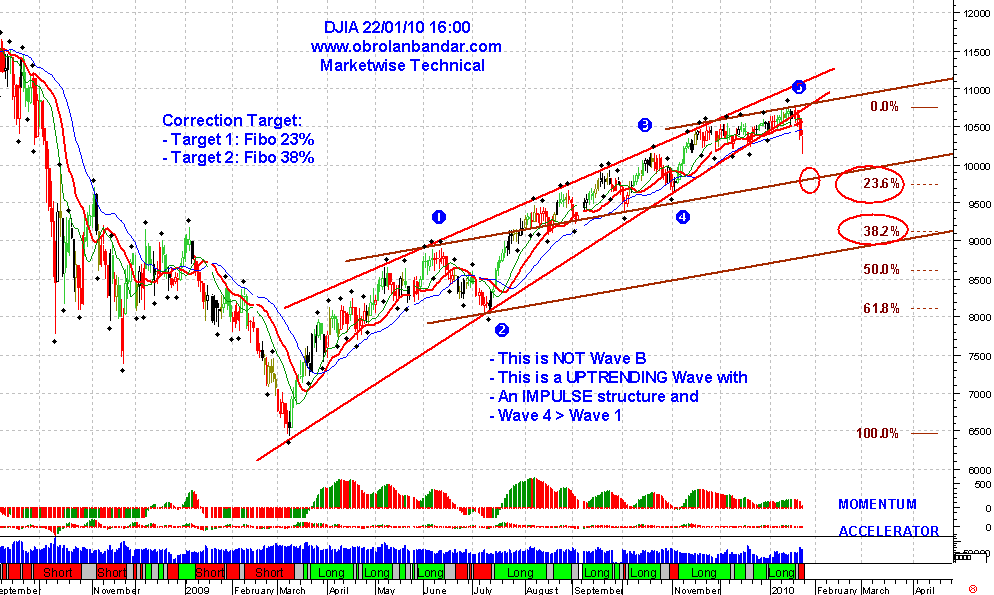
Oh maap2 Pak... BTW saya mbacanya dari karikatur2 yg ada aja sih, jadi kurang mendalam [:D] Ada yg pro ada yg kontra...fuih...mboh wis ndak tahu saya.... Kalo dari rubrik inilah.com Kira2 tokoh Anggodo dijadikan kucing ya ? [:-/] bener atau salah nggak ngerti dech [:-B] http://coretanpinggir.com/2009/07/20/sibuk-mempreteli-cicak/ <http://coretanpinggir.com/2009/07/20/sibuk-mempreteli-cicak/> Sumber : http://www.inilah.com/kartun/rubrik_editorial.php <http://www.inilah.com/kartun/rubrik_editorial.php> Don Anggodo http://www.inilah.com/data/berita/foto/176899.jpg <http://www.inilah.com/data/berita/foto/176899.jpg> `Si Kucing` Anggodo Widjojo http://www.inilah.com/data/berita/foto/176358.jpg <http://www.inilah.com/data/berita/foto/176358.jpg> Sekarang back to : IHSG dari DJI, Index USD dan Oil [:D] Index USD : http://www.incrediblecharts.com/tradingdiary/2009-11-05_forex.php <http://www.incrediblecharts.com/tradingdiary/2009-11-05_forex.php> Dollar Rally Ends By Colin Twiggs November 4, 2009 10:00 p.m. ET (2:00 p:m AET) The US Dollar Index retreated below support at 76, warning of a test of 75. Failure of 75 would offer a target of 74*. Recovery above 76 is unlikely, but would indicate a test of 77.50. In the long term, the primary down-trend is likely to test the 2008 low of 71.50, while breakout above 77.50 would signal that the down-trend has ended. * Target calculation: 75 - ( 76 - 75 ) = 74 DJI : http://www.incrediblecharts.com/tradingdiary/2009-11-07_markets.php <http://www.incrediblecharts.com/tradingdiary/2009-11-07_markets.php> Dow Jones Industrial Average The Dow is consolidating in a narrow band after recovering above 10000. Bearish divergence on Twiggs Money Flow (13-week) continues to warn of a secondary correction, but the shorter-term (21-day) indicator respected the zero line, indicating a resurgence of buyers. Breakout above 10100 would indicate that the correction has ended before it really started, signaling an advance to 10500*; while reversal below 9900 would warn of a correction. In the long term, a primary advance would offer a target of 12000*. * Target calculations: 10100 + ( 10100 - 9700 ) = 10500 and 10000 + ( 10000 - 8000 ) = 12000 Crude Oil http://www.incrediblecharts.com/tradingdiary/2009-11-04_gold_crude.php <http://www.incrediblecharts.com/tradingdiary/2009-11-04_gold_crude.php> Crude oil is retracing to test support between $72 and $75. Respect would signal primary advance to $85*. Reversal below the rising trendline is unlikely, but would warn that the primary up-trend is weakening, while failure of support at $66 would signal a reversal. * Target calculation: 75 + ( 75 - 65 ) = 85 IHSG menurut Papah Loreng.... FW: [ob] Trs: The saga continues JCI 2.650 12-12-09 Some reasons to start buying Indonesia Index rallying year-end to close upper price gap at 2.750 may be means of the market pricing in indo real GDP growth of 4.5% in 2009, 6.0% in both 2010 & 2011, and real exchange rate appreciation to Rp.9100 given the IDR's position as a commodity currency versus likelihood of oil hitting $100/b by year end 2009. There is a possibility for the bull market to continue until March 2010 with JCI 3,000 becoming a likely target. Corrections and consolidations stopped at 10% threshold level as long as low interest rate and inflation environment stays the same. Now the upward rectracement rally starts! Rising consumption driven by stronger rupiah, low interest rates and fuel prices, are likely to be key earnings drivers for banks (BBRI, BMRI, BBCA, BDMN), consumers (ASII, INDF) and property (ASRI) Another "bang for the buck" coal play would be BUMI, which now trades at PE09 9.5x far below JCI PE09 or 13.5x. Negative sentiment may have already been priced in. Mining counters such as ANTM and INCO remain controversial picks, with fundamental "unrealistic" 12-month sells stating downside targets of Rp.300 and 1.300. However there are still metal bulls, with 12-month fundamental targets of Rp.5.000 for INCO and Rp.2.800 for ANTM. From a technical standpoint, you want to positioned in ANTM or INCO for metal recovery in 2010. Despite the 80% rise since year end, some say that Indonesia is still the fourth cheapest market in Asia ex-Japan. Political unity which was lacking during the 2004-2009 administration is here to stay, with Golkar and PDIP all getting along for now. Foreigners that have been selling the market from peak of 2.556 to through of 2.250 (10% drop) may want to step back in particularly since valuations have become attractive. Jika membaca Postingan Embah.... http://finance.groups.yahoo.com/group/obrolan-bandar/message/204148 <http://finance.groups.yahoo.com/group/obrolan-bandar/message/204148> Kembali ke IHSG: - IHSG mengalami PELEMAHAN stuctural pada group BUMI, begitu banyak RETAIL yg nyangkut di group BUMI. - Jika BD masih RAKUS, yg NYANGKUT ini bakal DIMAMPUSKAN pada FAST+DEEP CORRECTION tahap 2. - Dari segi LQ45 lainnya, memang terjadi OUTFLOW saat IHSG melemah, tapi secara structural masih KOKOH. Mapping : From: obrolan-bandar@yahoogroups.com [mailto:obrolan-ban...@yahoogroups.com] On Behalf Of jsx_consultant Sent: 06 Nopember 2009 2:20 To: obrolan-bandar@yahoogroups.com Subject: [ob] Buaya Wallstreet dan Buaya Jakarta Buaya Wallstreet dan Buaya Jakarta Index Dowjones naik lagi diatas Buaya Wallstreet sesudah menyentuh GARIS SAKTI PIG's line http://www.obrolanbandar.com/pwldjia.png <http://www.obrolanbandar.com/pwldjia.png> Dan index Jakarta siap menunggangi Buaya Jakarta sesudah tidur 4 hari... http://www.obrolanbandar.com/piwihsg.png <http://www.obrolanbandar.com/piwihsg.png> Kesimpulan : DJI target Pendek 10.500, jika BREAK = 12.000. atau END Index USD target Pendek 74, jika BREAK = 71. atau END Crude Oil target Pendek = 85, jika BREAK = +/-100.atau END IHSG ? Target Pendek Papah Loreng = 2.650, jika BREAK target 3.000 (Q1 - 2010) atau END. Jika mengacu pada perhitungan Papah Loreng.... IHSG Weekly Chart <http://3.bp.blogspot.com/_2aKqvFC3Mmk/SvUh81xsJKI/AAAAAAAABIk/SeIPXpmcH\ -8/s1600-h/IHSG+-+Weekly+Plan.PNG> Dalam peta kira2 menggunakan W warna biru.... W4 menuju W5 Jika membaca STAY ALERT embah.... - Jika BD masih RAKUS, yg NYANGKUT ini bakal DIMAMPUSKAN pada FAST+DEEP CORRECTION tahap 2. Maka dalam peta diatas memakai W warna Hitam A menuju B Diperkecil dalam IHSG - 60 Menit <http://4.bp.blogspot.com/_2aKqvFC3Mmk/SvUh8vcGkUI/AAAAAAAABIc/T_TmJviA5\ es/s1600-h/IHSG+-+60+Menit+Plan.PNG> Dengan perkiraan Papah Loreng maka....memakai W warna biru... Sedangkan jika berasumsi FAST+DEEP CORRECTION = kurang lebih W warna hijau muda dengan formasi 5-3-5 ? Jika SIDEWAYS..ya tunggu sajalah.... STAY ALERT !!! [B-)] (gubraks) Ada ide yg lain ? monggo dipersilahkan..... Tks Regards >