Hi

Am 20.06.2011 12:40, schrieb Fixdit:
The input is very much appreciated,
I'm kind of new to Open Layers and feeling my way around. How would I
generate the curve? Via a mask or a would this be incorporated into the
images pre render?
Talking about how daylightmap.com did it, I guess they're using a shapefile or a postgis-db that holds an approximation of that curve. I don't think, they calculate the shape just-in-time.
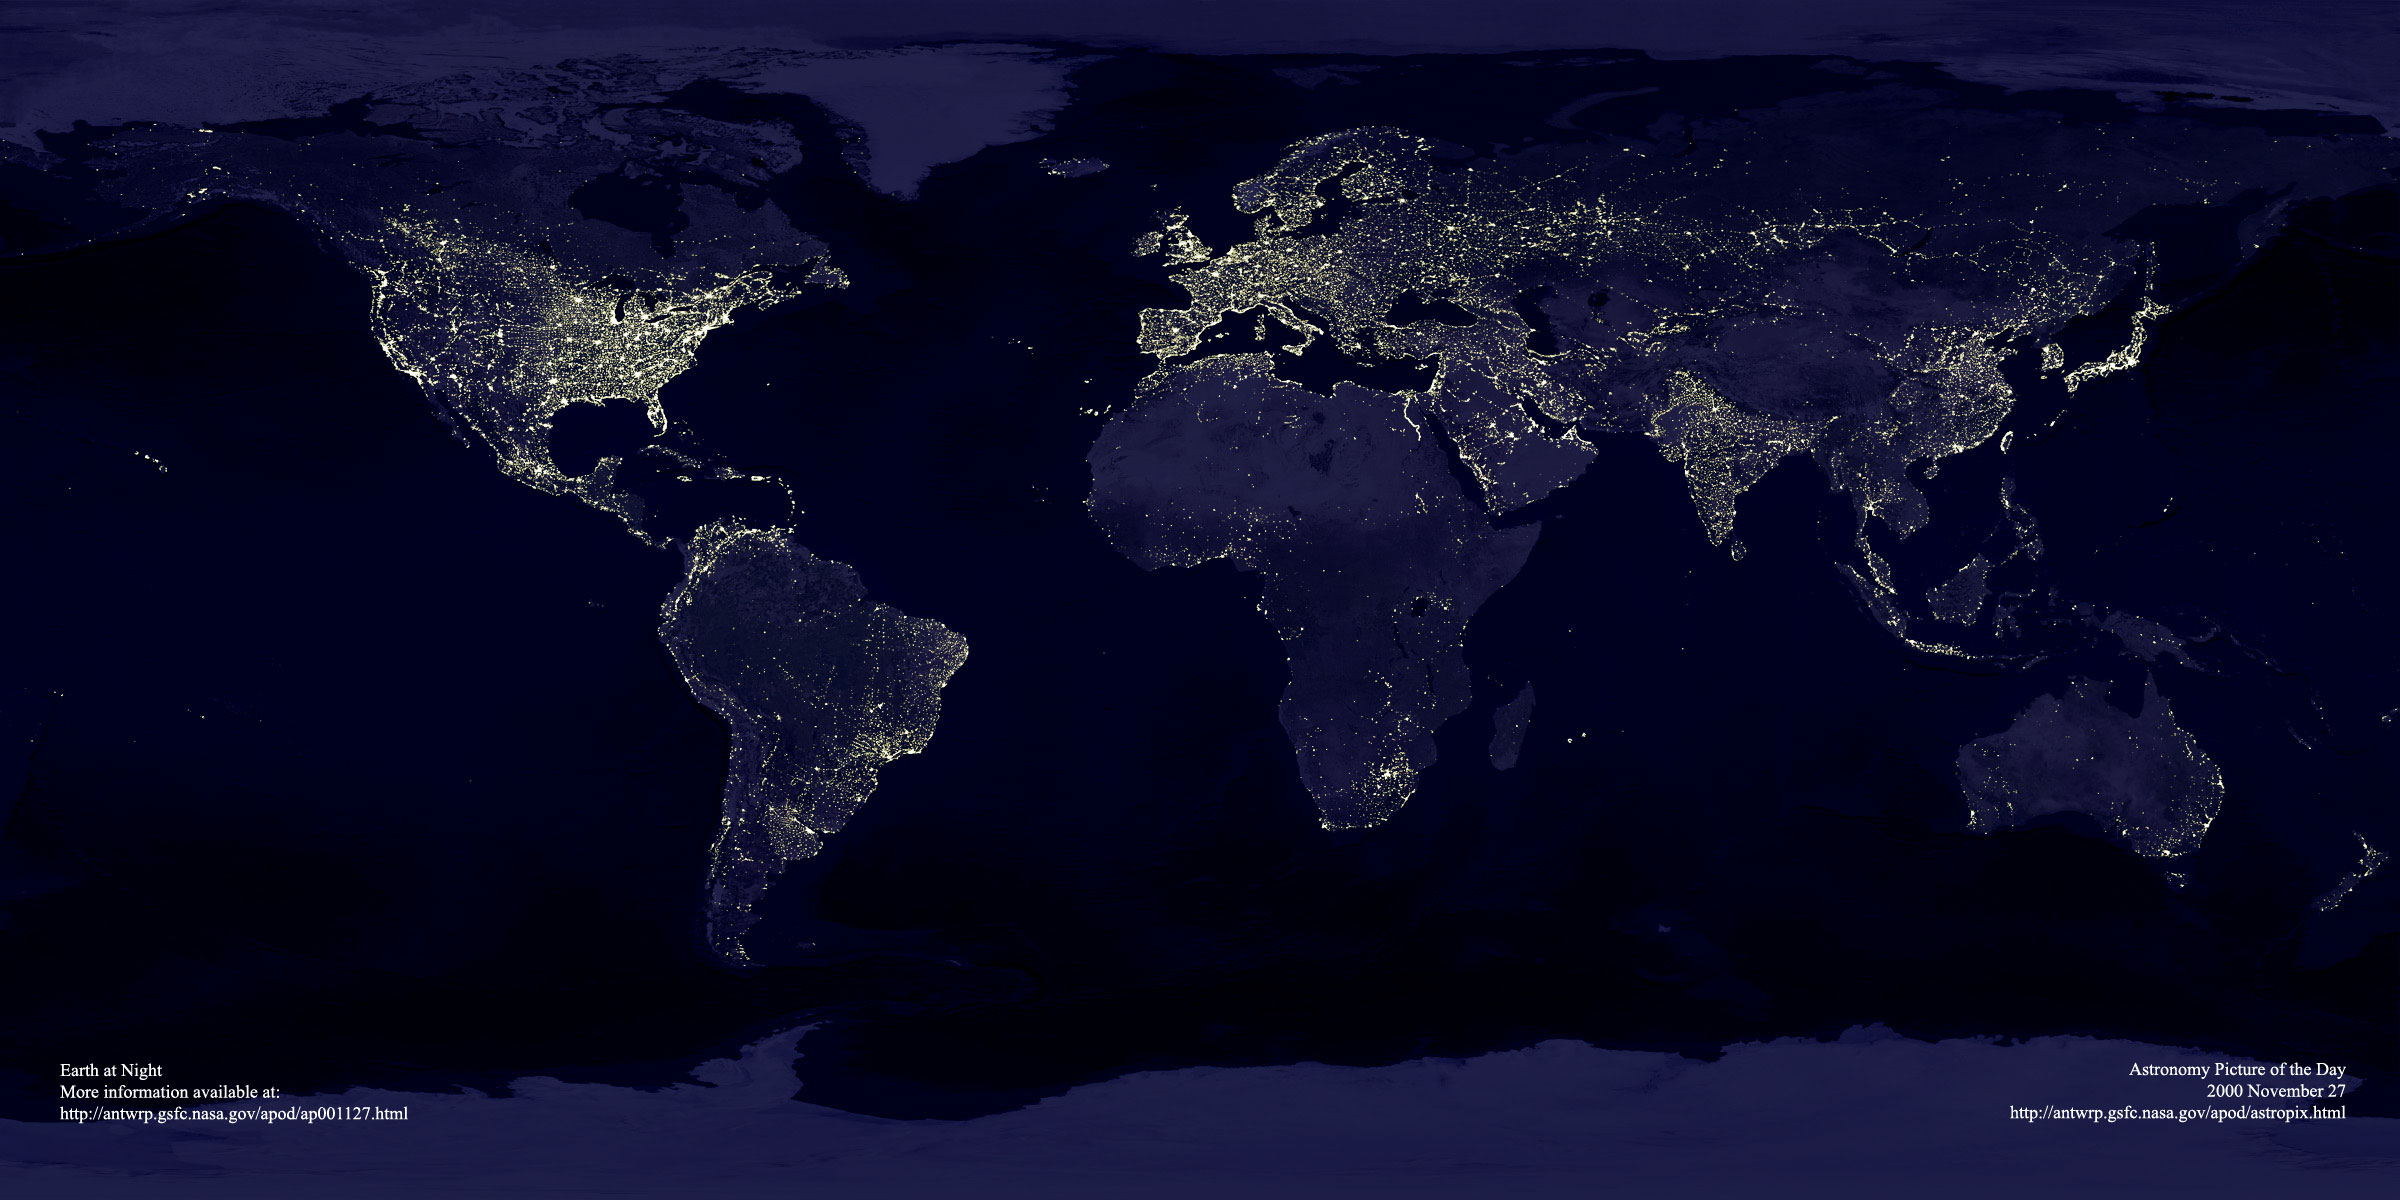
Additionally they likely have some data-source for the lighting part (eg. http://apod.nasa.gov/apod/ap001127.html, see: http://apod.nasa.gov/apod/image/0011/earthlights2_dmsp_big.jpg)
Those two sources are combined at the server side into one image, possibly using some WMS or some Tile-Server infratructure (Tirex/Mapnik), producing those tiled images: http://www.daylightmap.com/tiles/cache/tile_n_3_0_2_1308564480.png
If you want it Changing by time, You need one pre-rendered tile per hour.

Peter
_______________________________________________
Dev mailing list
d...@lists.osgeo.org
http://lists.osgeo.org/mailman/listinfo/openlayers-dev