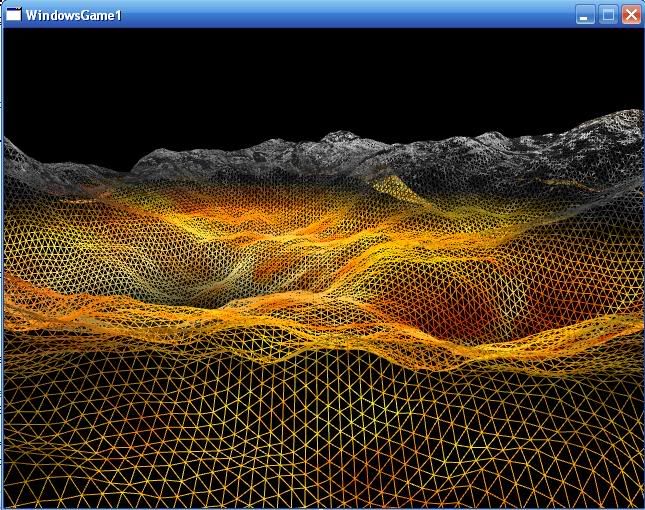
Hi,
Because your data are structured points, I think that the following
pipeline would do the trick:
reader -> Extract Surface -> Warp by Scalar

You have small spacing compared to the height. So be careful of the warp factor.

HTH
Jerome

2010/5/10 motes motes <[email protected]>:
> I have this very simple image file:
>
> # vtk DataFile Version 3.0
> created by bob
> ASCII
> DATASET STRUCTURED_POINTS
> DIMENSIONS 4 4 1
> ORIGIN 0.000000 0.000000 0.000000
> SPACING 0.1000000 0.1000000 0.1000000
> POINT_DATA 16
> SCALARS HorizontalSpeed double
> LOOKUP_TABLE default
> 6
> 8
> 3
> 2
> 3
> 9
> 3
> 1
> 1
> 3
> 5
> 7
> 3
> 4
> 3
> 3
>
>
> The value of the above points correspponds to the intensity/height of
> each pixel.
>
> Is it possible to plot the above intensities as a heightmap (surface
> in 3D)? Something like this:
>
> http://i9.photobucket.com/albums/a59/craigory666/heightMapTerrain.jpg
>
> when adding more points.
> _______________________________________________
> Powered by www.kitware.com
>
> Visit other Kitware open-source projects at
> http://www.kitware.com/opensource/opensource.html
>
> Please keep messages on-topic and check the ParaView Wiki at:
> http://paraview.org/Wiki/ParaView
>
> Follow this link to subscribe/unsubscribe:
> http://www.paraview.org/mailman/listinfo/paraview
>
_______________________________________________
Powered by www.kitware.com

Visit other Kitware open-source projects at
http://www.kitware.com/opensource/opensource.html

Please keep messages on-topic and check the ParaView Wiki at:
http://paraview.org/Wiki/ParaView

Follow this link to subscribe/unsubscribe:
http://www.paraview.org/mailman/listinfo/paraview