Dear all,
Unfortunately, I am still struggling with running MPI and producing
coloured
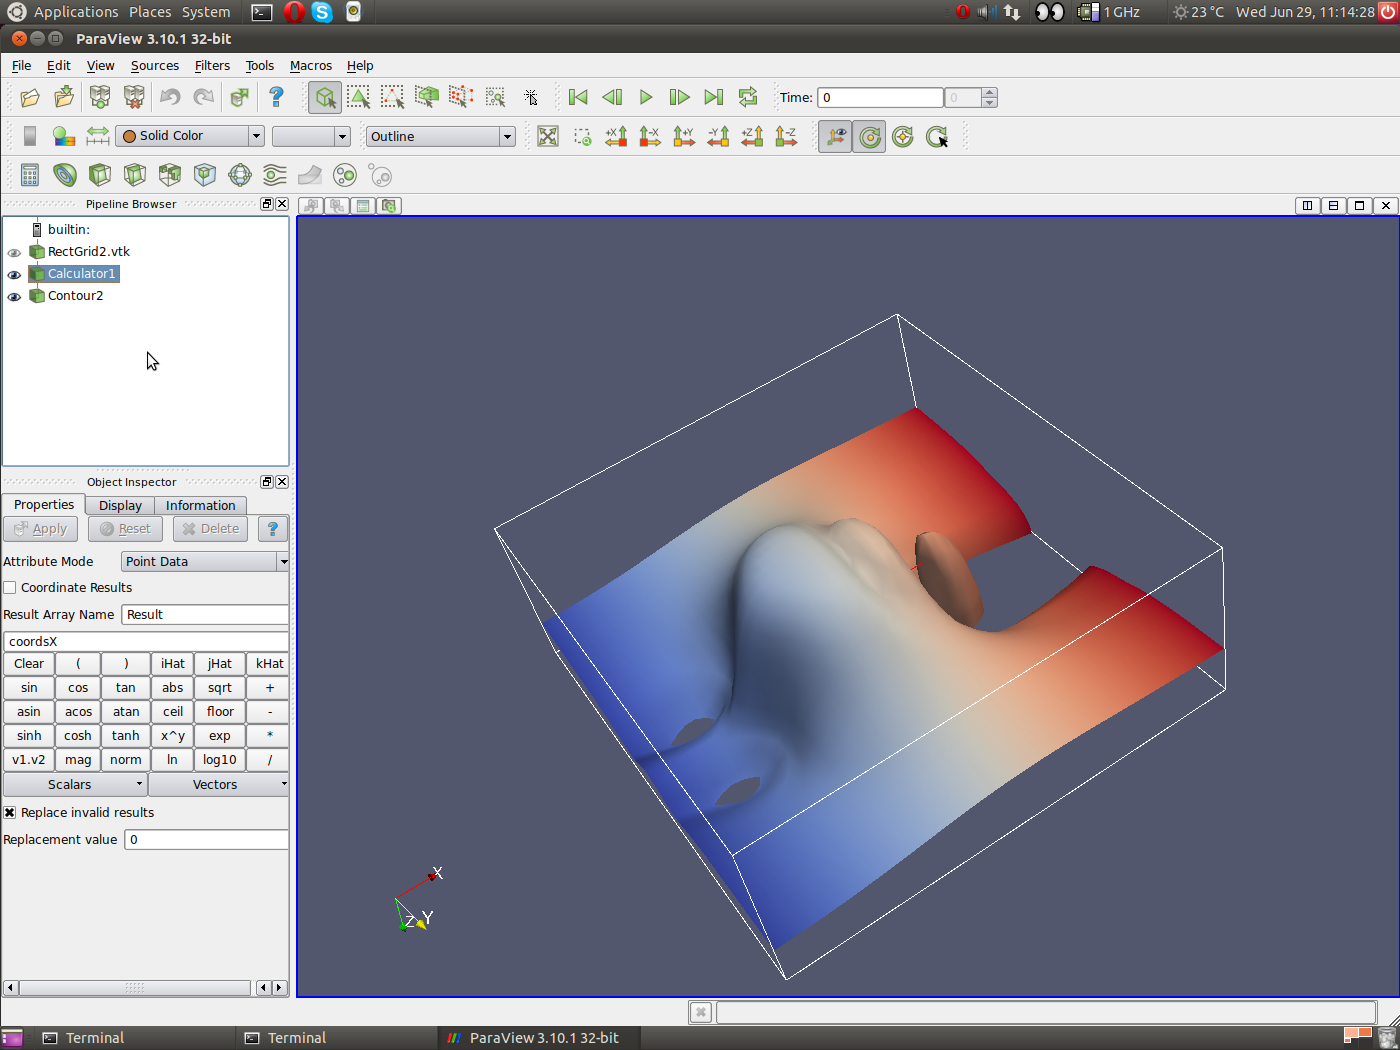
isosurfaces. A screenshot exemplifying the problem can be found at
http://www.mech.kth.se/~pschlatt/files/Screenshot.png; note that the
colour
scheme based on the x-coordinate is just to show the problem, but in
reality
I am using some scalar data coming from file.

Anyway, I wanted to ask you whether any of you has had similar problems,
i.e. colouring isosurfaces when running MPI. It seems to me that the
data
field used to colour the surfaces is only created on one MPI rank and
then
used by all other ranks, instead of computed for each rank independently
based on the local data. Can anyone confirm that behaviour?
This problem makes it at the moment impossible for me to visualise a
certain
very large data set as I need to use MPI to distribute the data due to
memory limitation.
Thanks a lot for any help!
Philipp
-----Original Message-----
From: Philipp Schlatter [mailto:[email protected]]
Sent: den 20 juni 2011 22:55
To: 'Utkarsh Ayachit'
Cc: [email protected]
Subject: RE: [Paraview] FW: Coloured isosurfaces when running MPI
Dear Utkarsh,
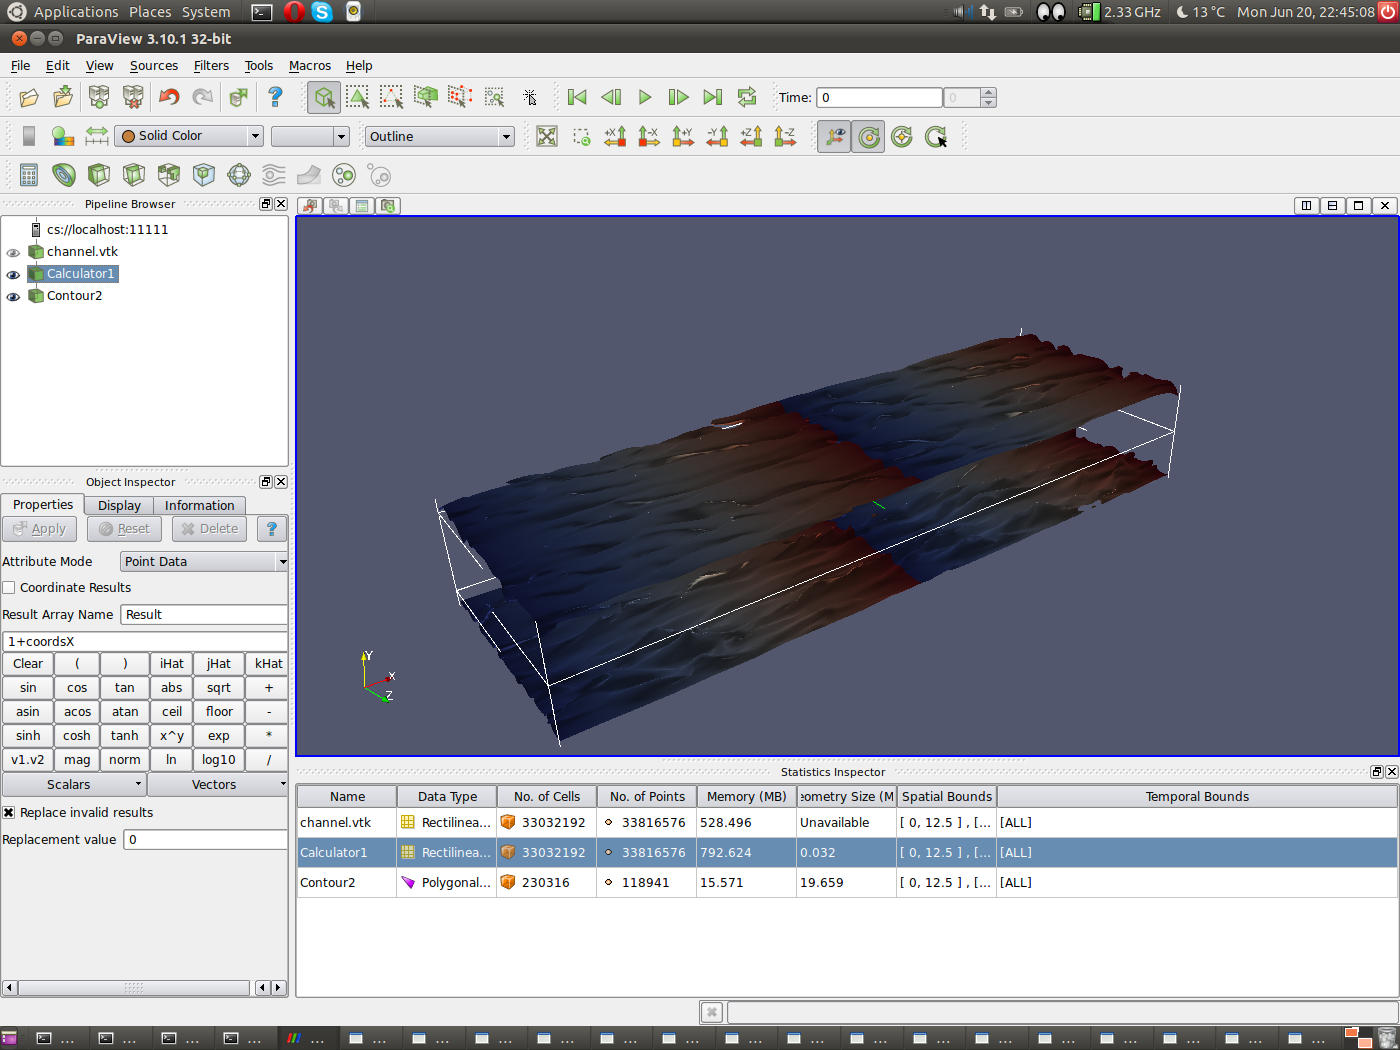
Thanks a lot for your answer. The type of my data is "Rectilinear Grid"
(turbulence data on a regular grid). The test case that I use to
reproduce
the data leads to a size of the contours (from the statistics inspector)
230316 cells, and a memory of 15 MB. I have turned off all the remote
render
thresholds etc. and the problem persists. Thus it is likely that it is
the
contour filter that causes the miscolouring.
I have just reroduced the problem using the latest version 3.10.1 (Linux
32-bit); and I generated a screenshot on
http://www.mech.kth.se/~pschlatt/files/Screenshot.png.
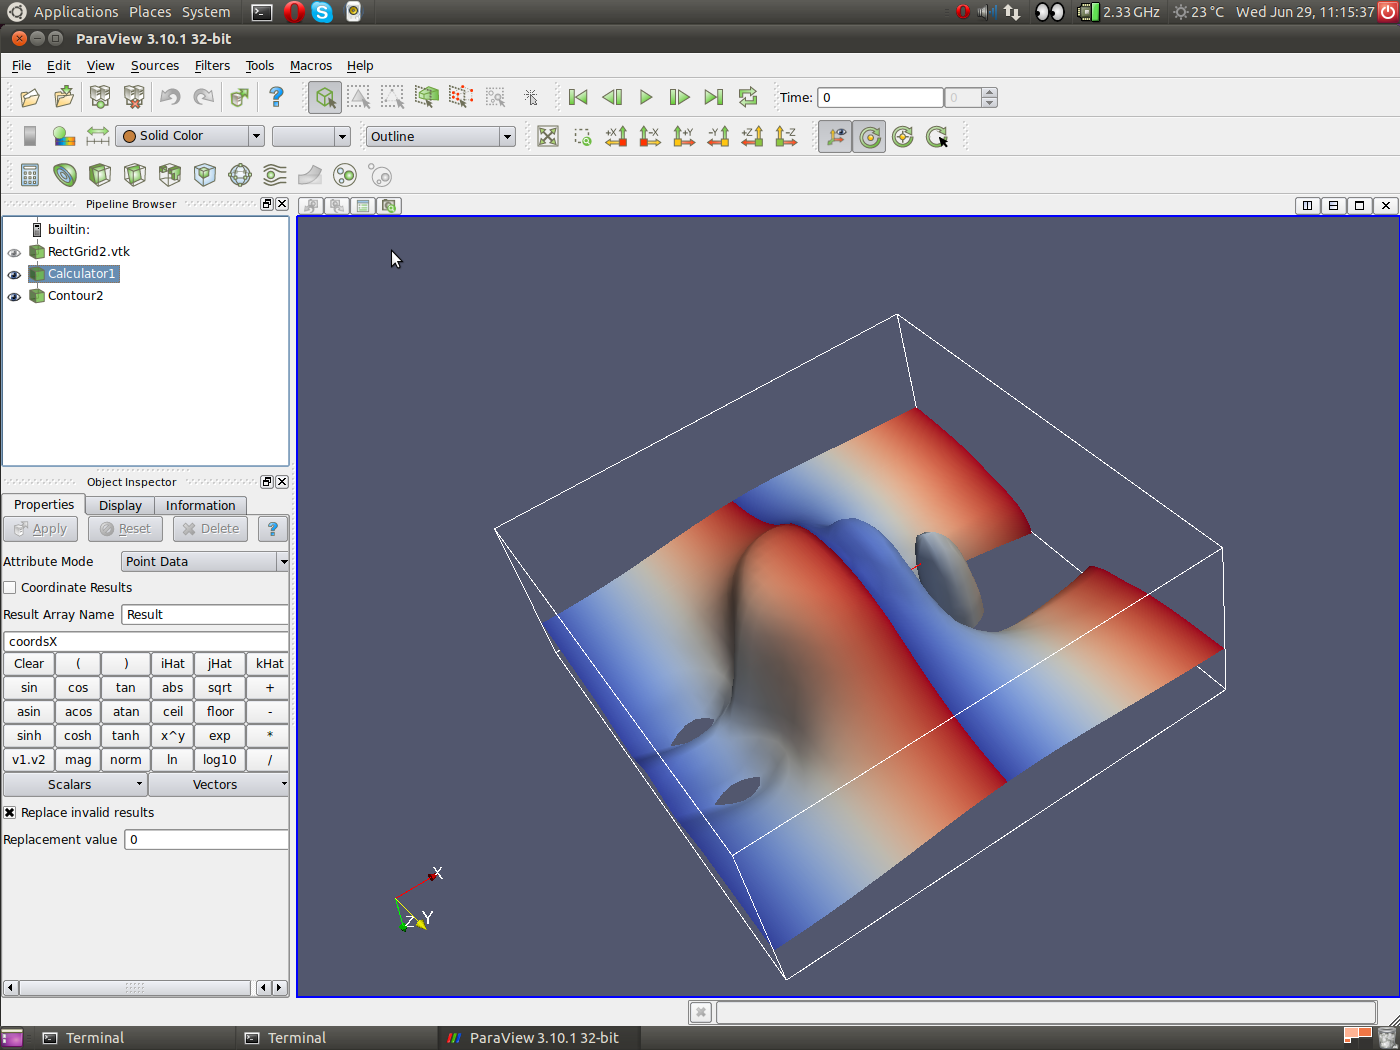
The test is simple; I read in a rectilinear grid with a few velocity
components. Then I compute a new scalar field, essentially being the
x-corrdinate. Then I plot an isocontour, and colour it with the result
of
the calculator. I would expect a continuous colour going from blue to
red
spread over the whole x extent, however - according to the number of
processors used (in that case 16) - I get a repetitive pattern. By some
more
experimenting it becomes clear that for some reason the colouring is
done
based on the scalar value on the first processor only.
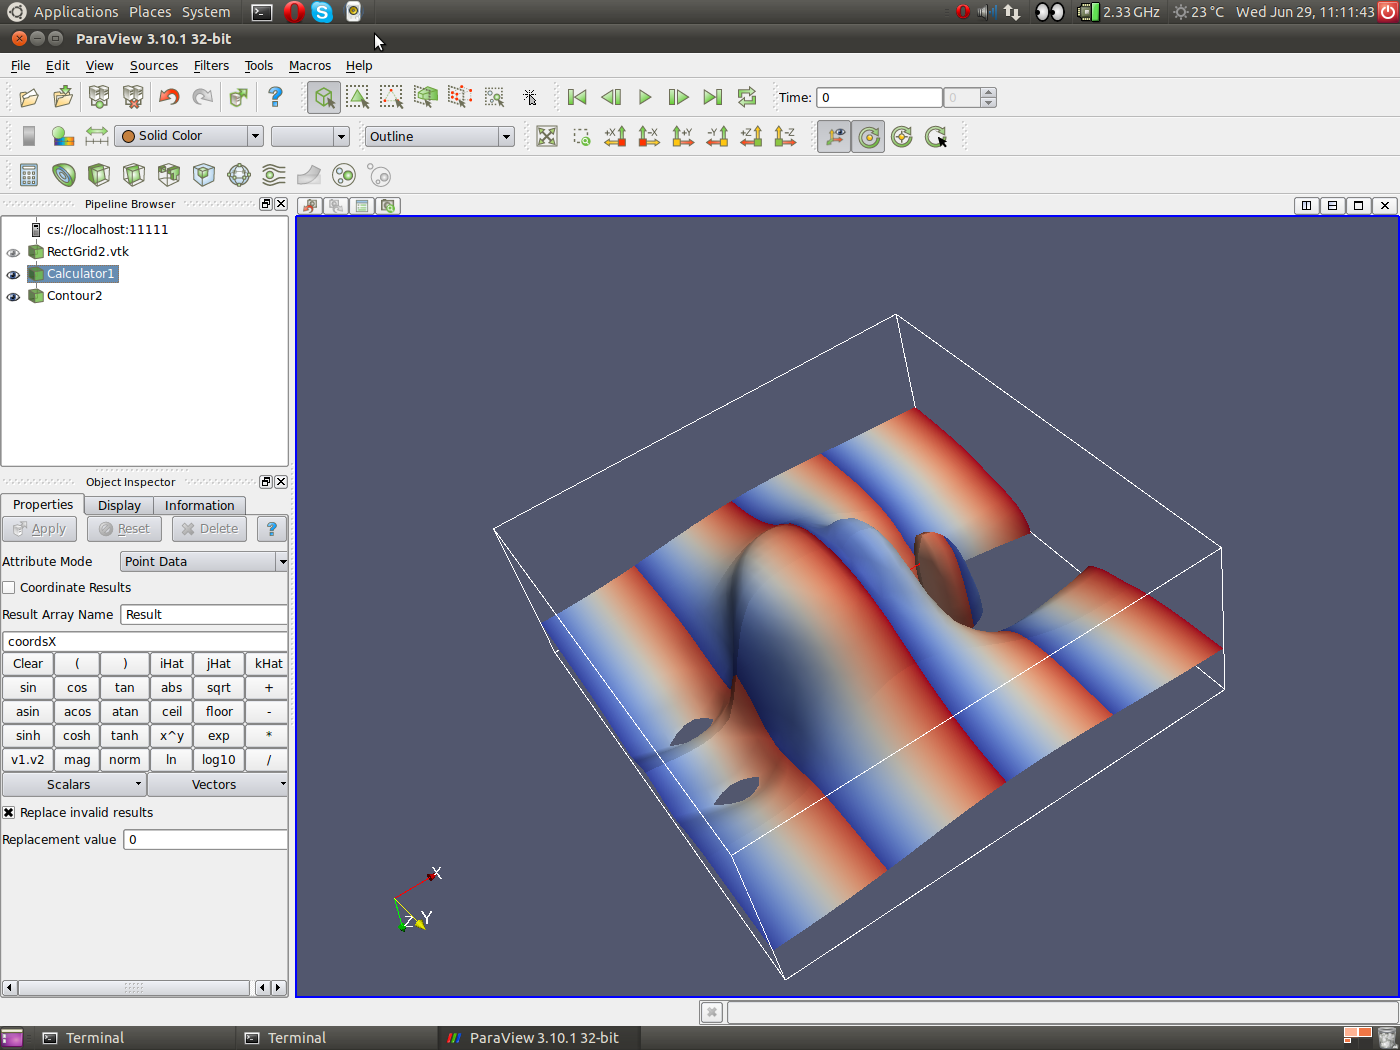
Running on 1 processor everything is fine.
I am of course happy to provide the respective data files, if this could
help.
Thanks for any help!
Best regards,
Philipp
-----Original Message-----
From: Utkarsh Ayachit [mailto:[email protected]]
Sent: den 20 juni 2011 16:59
To: Philipp Schlatter
Cc: [email protected]
Subject: Re: [Paraview] FW: Coloured isosurfaces when running MPI
That's very peculiar. What datatype are you contouring? (With the reader
selected in the pipeline browser, go to the information tab, what does
the
"Type" field say?) Also after generating the iso-surface, open the
statistics inspector (View | Statistics Inspector). What is the size of
the
geometry generated from the contour filter. If that's not too large,
you
try doing local-rendering (go to Edit | Settings, on the Server page,
uncheck Remote Render Threshold). Does that help? This will help
diagnose if
the issue is with rendering or with the data generated by the contour
filter
itself.

Utkarsh
On Sun, Jun 19, 2011 at 11:25 AM, Philipp Schlatter
<[email protected]>
wrote:
Dear forum,
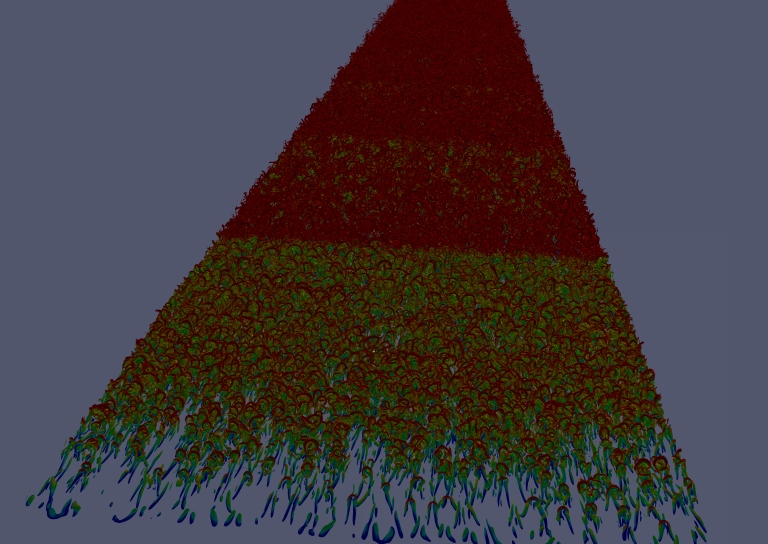
I am using Paraview to visualise a large dataset coming from a direct
simulation of turbulence (size of the original data of order 10-100GB).
Naturally, I am running in parallel on a cluster (using the mesa),
which also works very well.
However, there is one issue: I want to visualise isosurfaces of a
quantity, and colour them using another scalar quantity. When running
serial, everything is fine. When using multiple processors with MPI
leading to the data being distributed, the rendering of the
isosurfaces is
still ok.
However, the colouring seems to be based on the scalar field of the
first data segment (i.e. the first processor) only. This then leads to
very visible boundaries between the processors as the colours are
clearly not correct (see example on
http://www.mech.kth.se/~pschlatt/files/resampled.jpg). Again, running
on a single processor everything is correct, and running on different
numbers of processors will shift the edges.

This issue could be confirmed in all version up to 3.10.

Due to this, I am required to run in serial, which is very painful
both due to memory requirements and very long rendering times (up to
15 minutes for a single frame). Thus, if there would be a simple fix,
I'd
be very interested.
Thanks a lot in advance for any hint.
Best regards,
Philipp Schlatter
KTH Mechanics, Stockholm, Sweden

_______________________________________________
Powered by www.kitware.com

Visit other Kitware open-source projects at
http://www.kitware.com/opensource/opensource.html

Please keep messages on-topic and check the ParaView Wiki at:
http://paraview.org/Wiki/ParaView

Follow this link to subscribe/unsubscribe:
http://www.paraview.org/mailman/listinfo/paraview
_______________________________________________
Powered by www.kitware.com
Visit other Kitware open-source projects at
http://www.kitware.com/opensource/opensource.html
Please keep messages on-topic and check the ParaView Wiki at:
http://paraview.org/Wiki/ParaView
Follow this link to subscribe/unsubscribe:
http://www.paraview.org/mailman/listinfo/paraview