On Sun, 6 Feb 2011, Hans-Christoph Steiner wrote:
I've started to write a GUI for generating biquad coefficients
(something like Max/MSP's [filtergraph~]). I've gotten the GUI
interaction working well, now I'm looking for the algorithms for
generating a plot of the frequency response of a given set of biquad
coefficents? It'll end up being Tcl, but I can easily read C, Csound,
Java, Perl, Python, etc.
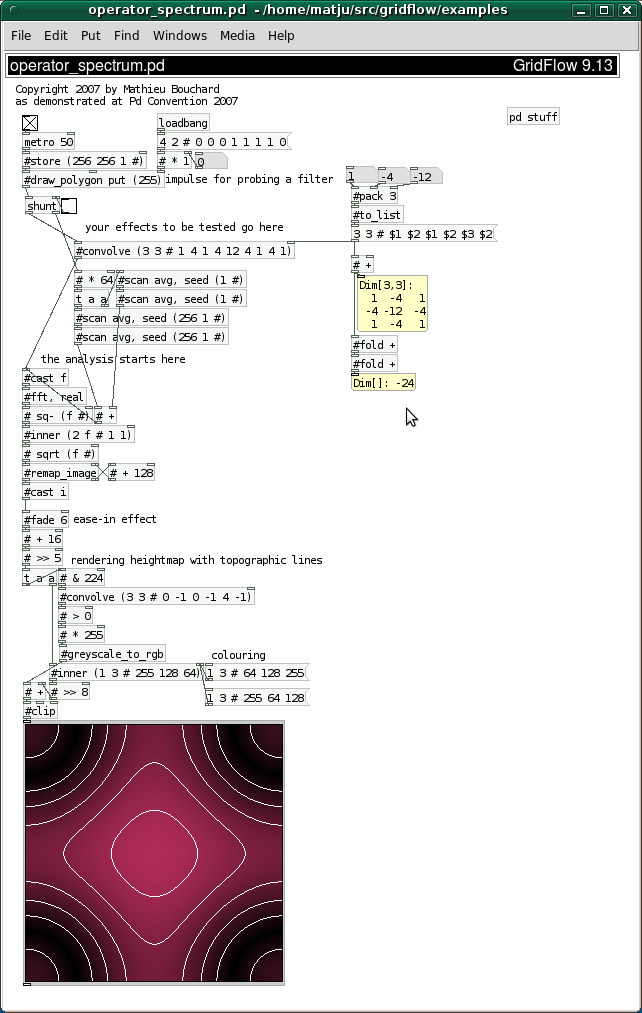
I made a rather simple patch that measures the frequency response of any
linear filter of your choice (convolution, lop, hip, bp, biquad, etc.) by
using FFT. I demonstrated it at Pd Convention 2007.
  http://gridflow.ca/gallery/operator_spectrum.png

except it only works for image filters, not sound.
It plots an image filter's spectrum like a topographic map for all
combinations of horiz-frequencies and vert-frequencies at once. (however,
it assumes that the effect is wrap-around, just like a FFT is wrap-around)
 _______________________________________________________________________
| Mathieu Bouchard ---- tél: +1.514.383.3801 ---- Villeray, Montréal, QC
_______________________________________________
[email protected] mailing list
UNSUBSCRIBE and account-management ->
http://lists.puredata.info/listinfo/pd-list