Dear list,
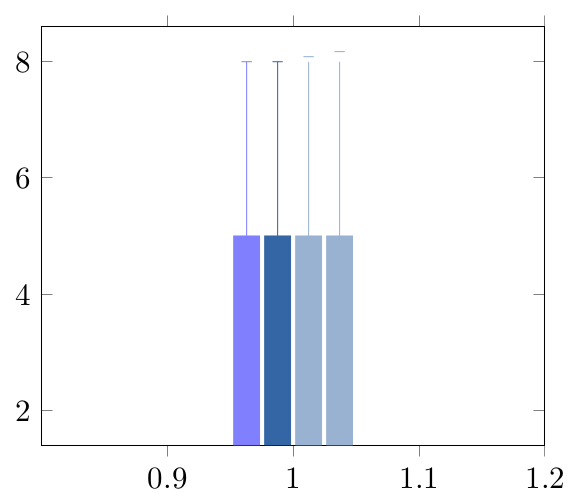
I'm using pgfplots to create some bar charts with error bars in ConTeXt,
and I want to use custom colours for them. This works, but if I mix a
custom colour with another colour, it results in a gap between the
error bar line and the error bar mark. If two custom colours are
mixed, the gap seems to be doubled. Mixing with predefined colours
works normally. MWE:
\usemodule[tikz]
\usemodule[pgfplots]

\definecolor    [Blue]  [h=3465a4]
\definecolor    [White] [h=ffffff]

\pgfplotsset{compat=newest}

\starttext
\starttikzpicture
        \startaxis[ybar, error bars/y dir=both, error bars/y explicit]
                \addplot+[blue!50!white] coordinates {(1,5) +- (0,3)};
                \addplot+[Blue] coordinates {(1,5) +- (0,3)};
                \addplot+[Blue!50!white] coordinates {(1,5) +- (0,3)};
                \addplot+[Blue!50!White] coordinates {(1,5) +- (0,3)};
        \stopaxis
\stoptikzpicture
\stoptext

Here you can see the result:
http://666kb.com/i/cl86t0mfpin35tht7.png

Kind regards,
Joshua Krämer


------------------------------------------------------------------------------
CenturyLink Cloud: The Leader in Enterprise Cloud Services.
Learn Why More Businesses Are Choosing CenturyLink Cloud For
Critical Workloads, Development Environments & Everything In Between.
Get a Quote or Start a Free Trial Today.
http://pubads.g.doubleclick.net/gampad/clk?id=119420431&iu=/4140/ostg.clktrk
_______________________________________________
Pgfplots-features mailing list
[email protected]
https://lists.sourceforge.net/lists/listinfo/pgfplots-features