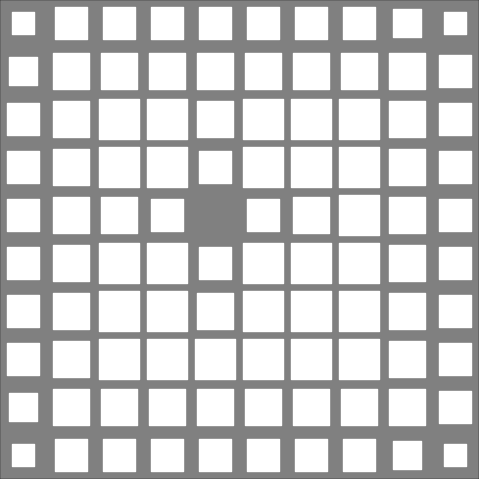
It's certainly possible.

You didn't give any data, and I do not feel like trying to replicate
your original numbers from the image you gave, so I will just use some
arbitrary numbers:
   data=: ?10 10$0

Now, let's say that your squares are 25 pixels on a side. We can form
squares like this:

   $square=: (>./~|i:12)%12
25 25

That's a bit big for email, so here's a smaller version:

   4%~>./~|i:4
1    1    1    1    1    1    1    1 1
1 0.75 0.75 0.75 0.75 0.75 0.75 0.75 1
1 0.75  0.5  0.5  0.5  0.5  0.5 0.75 1
1 0.75  0.5 0.25 0.25 0.25  0.5 0.75 1
1 0.75  0.5 0.25    0 0.25  0.5 0.75 1
1 0.75  0.5 0.25 0.25 0.25  0.5 0.75 1
1 0.75  0.5  0.5  0.5  0.5  0.5 0.75 1
1 0.75 0.75 0.75 0.75 0.75 0.75 0.75 1
1    1    1    1    1    1    1    1 1

(That's basically the same expression, I just moved the division over
to the left hand side, and changed the 12 to a 4, so it's 5 by 5. The
point isn't the expression so much as the resulting data. It's
arranged as a square with values ranging from 0 in the center to 1 at
the edge.)

Now, we just need to compare this to each of our original values, form
them into a square, and pass that on to viewmat:

   require'viewmat'
   viewmat ,/0|:,/0 2|:data >:/ square

Good enough?

Or would an explanation of the steps in any of those expressions help?

(You can shave off parts of an expression to see what was passed
along, and you can shrink the data so you can inspect those
intermediate results easier. You can also use J's trace facility
and/or dissect. You can also of course read up on things in the
dictionary. But sometimes, especially after you've tried some of those
other approaches, it can be good to have someone else give their
perspective - not so much because it's not simple but because having
other people's words can help you think about things from a slightly
different perspective.)

Thanks,

--
Raul

On Tue, Jan 20, 2015 at 11:48 PM, Ryan <[email protected]> wrote:
> I have a matrix of probabilities that I'd like to visualise similar to this:
> http://emotion.inrialpes.fr/people/synnaeve/phdthesis/images/battleship_board_3_1miss.png
> where the bigger the probability, the bigger the square.  The closest I've
> come is a simple
> density plot
>
>         mymat=? 27 27$0
>     load 'graphics/plot viewmat'
>     'density' plot mymatrix
>     NB. or
>     viewmat mymatrix
>
> I've looked through plot's source code but don't see an option for something
> like this.
>
> Does someone know if it's possible to do?
>
> thanks for any help,
> Ryan
>
>
>
> The information in this e-mail is intended only for the person to whom it is
> addressed. If you believe this e-mail was sent to you in error and the
> e-mail
> contains patient information, please contact the Partners Compliance
> HelpLine at
> http://www.partners.org/complianceline . If the e-mail was sent to you in
> error
> but does not contain patient information, please contact the sender and
> properly
> dispose of the e-mail.
>
> ----------------------------------------------------------------------
> For information about J forums see http://www.jsoftware.com/forums.htm
----------------------------------------------------------------------
For information about J forums see http://www.jsoftware.com/forums.htm