I believe I replied to this in June of this year with a general solution.

Here's an example where I label the highest and lowest point in a plot with
their values:
rr=. _100+50?201 NB. Random points to plot
whhl=. rr i. (>./,<./)rr NB. Find highest and lowest and
rr=. (10 _10+whhl{rr) whhl}rr NB. exaggerate each to stand out
'hp lp'=. (>./,<./)rr NB. High and Low points to label
xhi=. ":<.0.5+(1000*(#rr)%~rr i. hp) NB. Estimate x-position of high
yhi=. ":1000-50 NB. Guess near top
xlow=. ":<.0.5+1000*(#rr)%~rr i. lp NB. Estimate x-position of low
ylow=. ":50 NB. Guess near bottom
NB. Place text for high point:
pd 'textfont Courier 12 Bold;textcolor GREEN'
pd 'text ',xhi,' ',yhi,' High=',":hp
NB. Place text for low point:
pd 'textfont Courier 12 Bold;textcolor RED'
pd 'text ',xlow,' ',ylow,' Low=',":lp
NB. Use fat points
pd 'pensize 5'
pd 'type point'
pd <"1 rr,:~i.#rr
pd 'show'
...
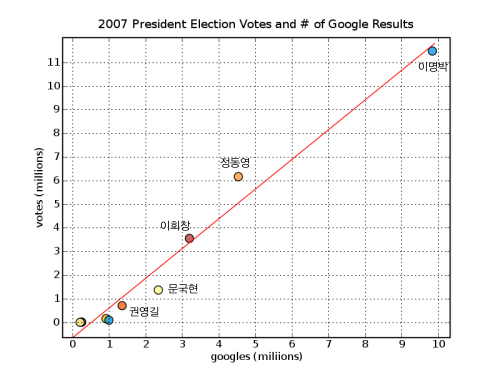
> > > Thanks but the label should be near the datapoint on the graph with a
> > > mark. Something like :
> > > http://farm3.static.flickr.com/2097/2126632476_bf8420ecff_o.png
> ...
>
--
Devon McCormick, CFA
^me^ at acm.
org is my
preferred e-mail
----------------------------------------------------------------------
For information about J forums see http://www.jsoftware.com/forums.htm