picture of the diff
https://user-images.githubusercontent.com/26199476/84378497-ed4b7b80-abec-11ea-8923-665d067607f1.png
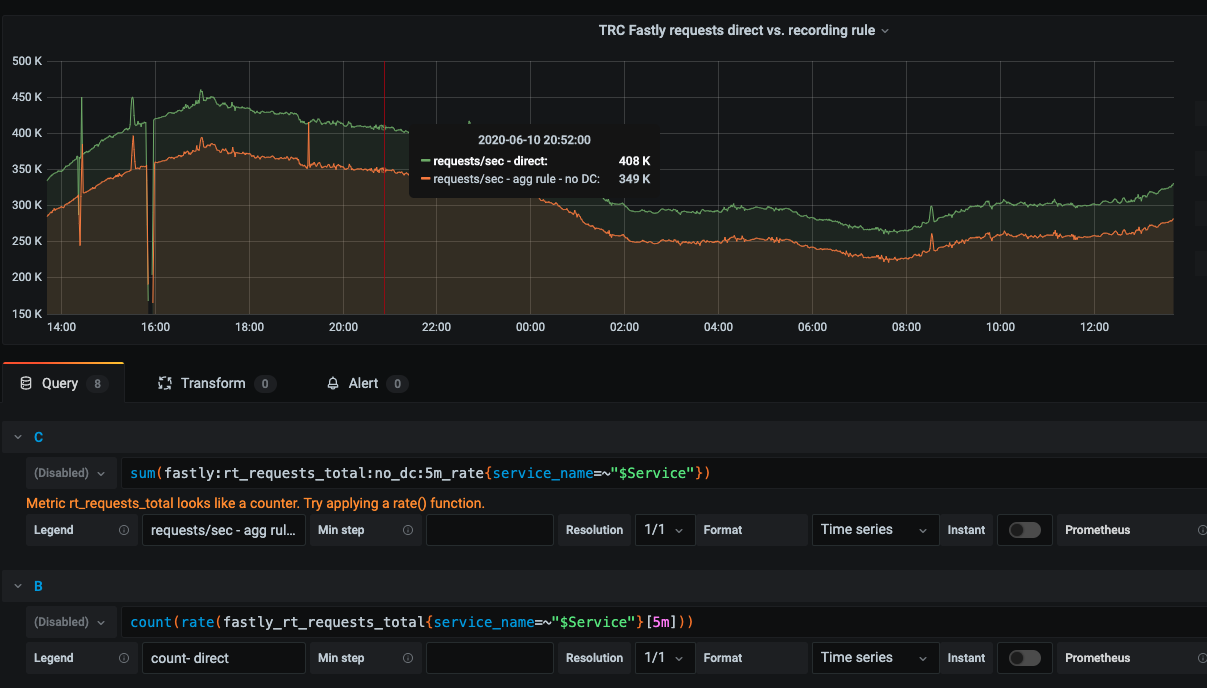
On Thursday, June 11, 2020 at 3:18:21 PM UTC+3 Michael Lando wrote:

> hi
> *,*in order to improve the query time we setup an aggregation rule,
> record: fastly:rt_requests_total:no_dc:5m_rate
> record: fastly:rt_requests_total:no_dc:5m_rate expr: sum
> without(datacenter) (rate(fastly_rt_requests_total[5m]))
>
>
> we expected the results of the aggregation to be a close match to the raw
> metric result.
>
> however
> we saw that there is a big difference between the results.
> the graphs trend looks correct but the total is off
>
>
>
> <https://user-images.githubusercontent.com/26199476/84378497-ed4b7b80-abec-11ea-8923-665d067607f1.png>
> additional info
> the raw metric is federated from a different Prometheus server whos
> scraping interval is 30s.
> we also tested the the aggregation rule but with out the sum on it
>
> record: fastly:rt_requests_total:5m_rate expr:
> rate(fastly_rt_requests_total[5m])
>
> in this case the result did match to the raw data.
>
> has any one encounted such a case?
>

--
You received this message because you are subscribed to the Google Groups
"Prometheus Users" group.
To unsubscribe from this group and stop receiving emails from it, send an email
to [email protected].
To view this discussion on the web visit
https://groups.google.com/d/msgid/prometheus-users/6a47dbf1-ce7b-4983-a4c1-2af8bf4ef887n%40googlegroups.com.