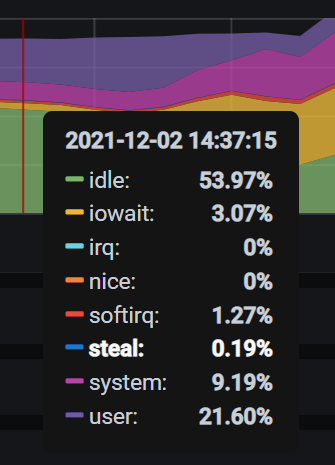
Hi Team,

I found from grafana's panel, the total usage of cpu is less than 100%, you
can see it from:
https://user-images.githubusercontent.com/38067786/144542289-4d2f329d-8a11-43a2-bd62-8c2eb712af0b.png.


the metrics is:
sum(irate(node_cpu_seconds_total{instance="$host"}[30s])) by (mode) * 100 /
count(node_cpu_seconds_total{instance="$host"}) by (mode)

But the command top shows the right cpu usage.

The whole info looks below:

Host operating system: output of uname -a

4.18.0-305.10.2.el8_4.x86_64
node_exporter version: output of node_exporter --version

node_exporter, version 0.17.0 (branch: HEAD, revision: f6f6194
<https://github.com/prometheus/node_exporter/commit/f6f6194a436b9a63d0439abc585c76b19a206b21>
)
build user: root@322511e06ced
build date: 20181130-15:51:33
go version: go1.11.2
node_exporter command line flags
#!/bin/bash set -e EXPORTER_BIN=bin/node_exporter/node_exporter if [ ! -f
$EXPORTER_BIN ]; then EXPORTER_BIN=bin/node_exporter fi exec $EXPORTER_BIN
\ --web.listen-address=":9100" \ --collector.tcpstat \ --collector.systemd
\ --collector.mountstats \ --collector.meminfo_numa \
--collector.interrupts \ --collector.buddyinfo \
--collector.vmstat.fields="^.*" \ --log.level="info"
Are you running node_exporter in Docker?

No
What did you do that produced an error?

the metrics is:
sum(irate(node_cpu_seconds_total{instance="$host"}[30s])) by (mode) * 100 /
count(node_cpu_seconds_total{instance="$host"}) by (mode)

Nothing, just run some workload.
What did you expect to see?

The total usage of cpu should be 100%
What did you see instead?

Add these usage, we get the total cpu usage is 89% < 100%. I
ran top command in a terminal, top's result is currect.


Best regards,

Wenbo

--
You received this message because you are subscribed to the Google Groups
"Prometheus Users" group.
To unsubscribe from this group and stop receiving emails from it, send an email
to [email protected].
To view this discussion on the web visit
https://groups.google.com/d/msgid/prometheus-users/6f0899a5-2247-4230-8bf9-e6f47891e833n%40googlegroups.com.