Philip Gröger wrote:
Hi!
How can I create a 3D surface (or something like the picture on the FAQ
page http://www.vpython.org/contents/FAQ.html ) with python [or
vpython]. Didnt find anything in the Documentation under "graph"
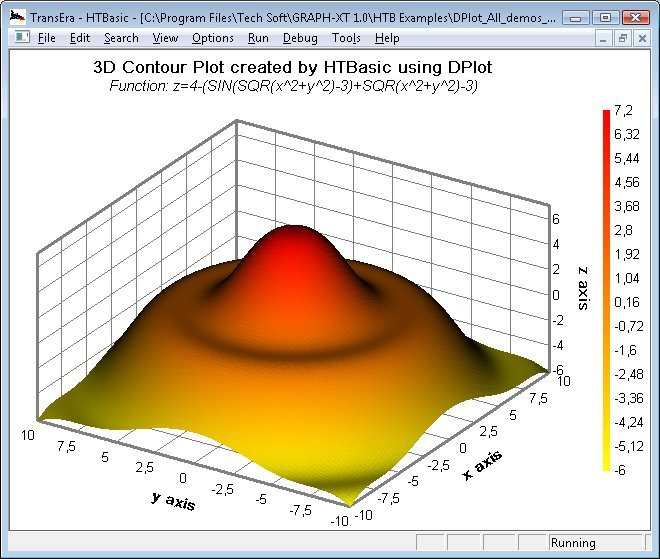
Basically like a contourf diagram in 3D
(http://www.techsoft.de/german/documents/images/3D_contour2.jpg). I
think you know what I mean.
Reason: I want to simulate waves in a square basin. Hope I dont need to
use hundrets of little spheres (in case of vpython) for the surface ;)
Thanks alot
- Philip
=========================
First of all, those are not quite contours, at least not as the mapping
industry uses the term. They are function generated cross sections,
perhaps rotated or translated, closely spaced, that have been rendered.
Rendered makes them pictures (rasters) and as such the base values are
no longer vectors.
If you are looking to create pictures you need to plot the points in 3D
space, rotate (in 3D space) to a viewpoint of choice and either render
the points if they are close enough or create a series of triangular
planes from the interior of the points. Do a Google on Triangulated
Irregular Networks (TIN). Also try http://wikipedia.org/
The TIN was originally created to aid in computer generated surfaces for
use in Aerial Mapping (Photogrammetry). The OG (original ground) could
be generated and then the Engineer or Designer could use that to base
his/her earth redistributions to a minimum in things like highways,
subdivisions and such. Later when GIS came along it borrowed the
equations and selected the raster format as it's base. Unfortunately
rasters are equally spaced points of same size along the X or Y axis
(can be same along both) thus forming a grid. TIN points are NOT on a
grid. They occur where needed to dot outline the surface. Coupled with
break lines (polylines, sometimes called line strings) to trace an edge
(like edge of mountain road) the TIN can depict very accurately a
surface. Mother Nature uses quite a number of math functions in just
your front yard. The proper dotting of the area reduces the overall
number of points required to 'shape' the surface.
Contours, in mapping, are connected lines of equal elevation. Contours
do not touch each other. Look up Topographic Maps, Lines of Equal
Elevation, Contours, 2D representations of 3D objects, Photogrammetry,
Land Surveying - subsection volumes.
For a single function you can look at the choices you named. I think
Rasterman has (had?) a good rendering program which could be used to
render any formula output you may want to generate. Re-run your graphs
with small increments and combine outputs and render. Should work.
Waves are just cyclic output. (Crest and trough) Direction gets changed
in small increments radiating out from point of creation and bounce (off
wall) is part of path. Time determines total length. How complicated is
that? The combined 360 degree outputs for a given time slice (time from
creation) provides 'surface' at that point. Add 'vigor' factors to
control frequency and strength (amplitude) of waves.
I'm assuming you can do the math. That being the case, it should be a
nice programming exercise.
Good Luck;


Steve
--
http://mail.python.org/mailman/listinfo/python-list