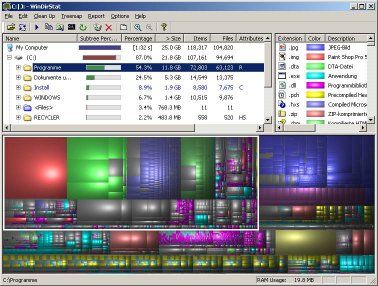
Hi,I'm trying to graph something that looks like the bottom half of this http://windirstat.info/images/windirstat.jpg I was wondering if there is any API in python or wxPython specifically to do this? I know it is possible to do calculation manually and use floatcanvas or something similar but I was wondering if something like this has already been done.
Cheers
Astan
--
http://mail.python.org/mailman/listinfo/python-list