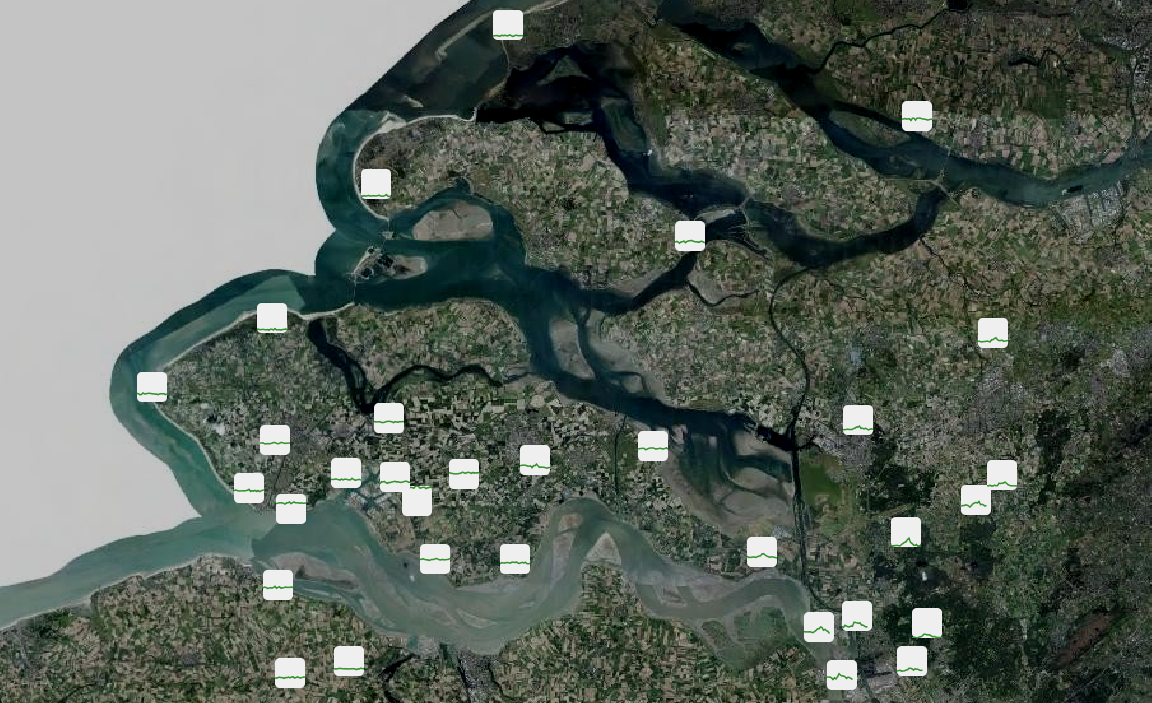
Here is an example of a map with code generated svg images as symbols.
The quick and dirty script does:
- aggregate all features from input point layer with same geometry
- calculate min/max times and values for whole set
- create svg files for every feature with filename based on id
- create a layer in qgis

Manually i added the data defined filename based on the id:

'/tmp/img_measure_' || "imgid" || '.svg'

Et voila!

http://terglobo.nl/downloads/voorbeeld_kaart_01.png

Thank you all for your suggestions!

Raymond


On 26-06-16 11:58, Raymond Nijssen wrote:
> There is this library to make it easier:
>
> https://pypi.python.org/pypi/svgwrite/
>
> And since it is python, you can use the standard code editor in QGIS (or
> an external one if you prefer).
>
> Raymond
>
> On 25-06-16 21:33, Lauri Kajan wrote:
>> This would be great also for nautical charts to render light sectors
>> from S57 data.
>>
>> Could existing code editor be used to construct the svg with some python
>> svg library?
>>
>>
>> -Lauri
>>
>>
>> _______________________________________________
>> Qgis-developer mailing list
>> [email protected]
>> List info: http://lists.osgeo.org/mailman/listinfo/qgis-developer
>> Unsubscribe: http://lists.osgeo.org/mailman/listinfo/qgis-developer
>>
>
> _______________________________________________
> Qgis-developer mailing list
> [email protected]
> List info: http://lists.osgeo.org/mailman/listinfo/qgis-developer
> Unsubscribe: http://lists.osgeo.org/mailman/listinfo/qgis-developer
>

--
Terglobo
Fahrenheitstraat 1
5223 BJ 's-Hertogenbosch
06 25 31 49 83
_______________________________________________
Qgis-developer mailing list
[email protected]
List info: http://lists.osgeo.org/mailman/listinfo/qgis-developer
Unsubscribe: http://lists.osgeo.org/mailman/listinfo/qgis-developer