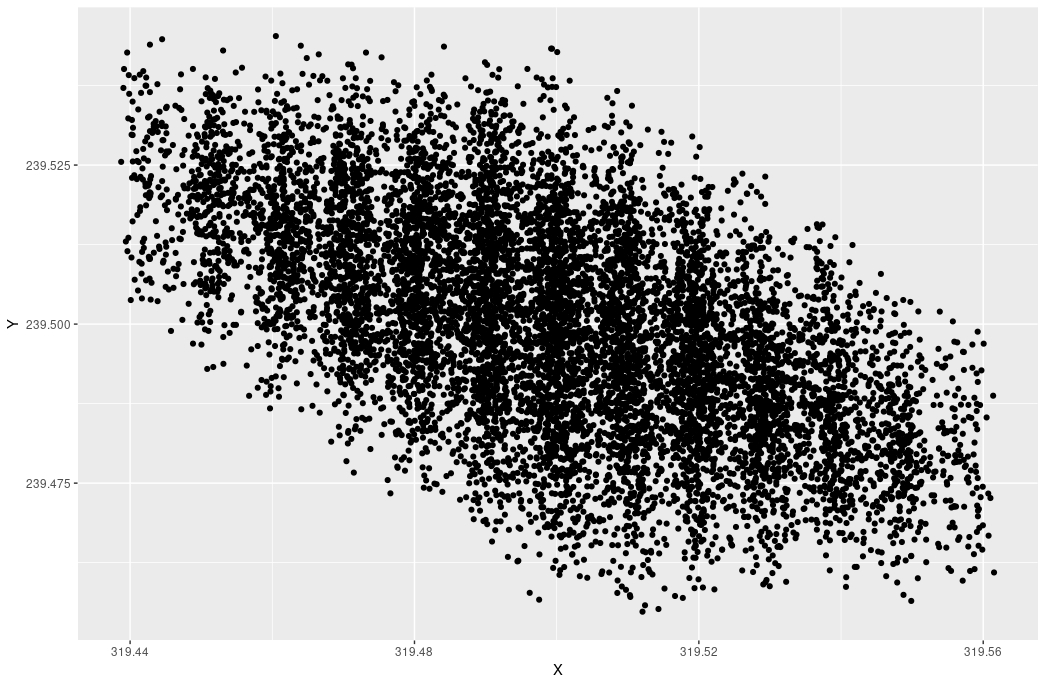
Hello,

Top posting. Several people have asked about the code to replicate my
results. I have cleaned up the code to remove an x/y coordinate bias for
displaying the results directly on a 640 x 480 VGA adapter. You can find the
code here:
http://people.redhat.com/sgrubb/files/vseq.c

To collect R samples:
X <- runif(10000, min = 0, max = 65535)
write.table(X, file = "~/r-rand.txt", sep = "\n", row.names = FALSE)

Then:
cat ~/r-rand.txt | ./vseq > ~/r-rand.csv

And then to create the chart:

library(ggplot2);
num.csv <- read.csv("~/random.csv", header=T)
qplot(X, Y, data=num.csv);

Hope this helps sort this out.

Best Regards,
-Steve

On Thursday, September 20, 2018 5:09:23 PM EDT Steve Grubb wrote:
> On Thursday, September 20, 2018 11:15:04 AM EDT Duncan Murdoch wrote:
> > On 20/09/2018 6:59 AM, Ralf Stubner wrote:
> > > On 9/20/18 1:43 AM, Carl Boettiger wrote:
> > >> For a well-tested C algorithm, based on my reading of Lemire, the
> > >> unbiased "algorithm 3" in https://arxiv.org/abs/1805.10941 is part
> > >> already of the C standard library in OpenBSD and macOS (as
> > >> arc4random_uniform), and in the GNU standard library.  Lemire also
> > >> provides C++ code in the appendix of his piece for both this and the
> > >> faster "nearly divisionless" algorithm.
> > >>
> > >> It would be excellent if any R core members were interested in
> > >> considering bindings to these algorithms as a patch, or might express
> > >> expectations for how that patch would have to operate (e.g. re
> > >> Duncan's
> > >> comment about non-integer arguments to sample size).  Otherwise, an R
> > >> package binding seems like a good starting point, but I'm not the
> > >> right
> > >> volunteer.
> > >
> > > It is difficult to do this in a package, since R does not provide
> > > access
> > > to the random bits generated by the RNG. Only a float in (0,1) is
> > > available via unif_rand().
> >
> > I believe it is safe to multiply the unif_rand() value by 2^32, and take
> > the whole number part as an unsigned 32 bit integer.  Depending on the
> > RNG in use, that will give at least 25 random bits.  (The low order bits
> > are the questionable ones.  25 is just a guess, not a guarantee.)
> >
> > However, if one is willing to use an external
> >
> > > RNG, it is of course possible. After reading about Lemire's work [1], I
> > > had planned to integrate such an unbiased sampling scheme into the
> > > dqrng
> > > package, which I have now started. [2]
> > >
> > > Using Duncan's example, the results look much better:
> > >> library(dqrng)
> > >> m <- (2/5)*2^32
> > >> y <- dqsample(m, 1000000, replace = TRUE)
> > >> table(y %% 2)
> > >>
> > >       0      1
> > >
> > > 500252 499748
> >
> > Another useful diagnostic is
> >
> >    plot(density(y[y %% 2 == 0]))
> >
> > Obviously that should give a more or less uniform density, but for
> > values near m, the default sample() gives some nice pretty pictures of
> > quite non-uniform densities.
> >
> > By the way, there are actually quite a few examples of very large m
> > besides m = (2/5)*2^32 where performance of sample() is noticeably bad.
> > You'll see problems in y %% 2 for any integer a > 1 with m = 2/(1 + 2a)
> > * 2^32, problems in y %% 3 for m = 3/(1 + 3a)*2^32 or m = 3/(2 +
> > 3a)*2^32, etc.
> >
> > So perhaps I'm starting to be convinced that the default sample() should
> > be fixed.
>
> I find this discussion fascinating. I normally test random numbers in
> different languages every now and again using various methods. One simple
> check that I do is to use Michal Zalewski's method when he studied Strange
> Attractors and Initial TCP/IP Sequence Numbers:
>
> http://lcamtuf.coredump.cx/newtcp/
> https://pdfs.semanticscholar.org/
> adb7/069984e3fa48505cd5081ec118ccb95529a3.pdf
>
> The technique works by mapping the dynamics of the generated numbers into a
> three-dimensional phase space. This is then plotted in a graph so that you
> can visually see if something odd is going on.
>
> I used   runif(10000, min = 0, max = 65535)  to get a set of numbers. This
> is the resulting plot that was generated from R's numbers using this
> technique:
>
> http://people.redhat.com/sgrubb/files/r-random.jpg
>
> And for comparison this was generated by collecting the same number of
> samples from the bash shell:
>
> http://people.redhat.com/sgrubb/files/bash-random.jpg
>
> The net result is that it shows some banding in the R generated random
> numbers where bash has uniform random numbers with no discernible pattern.
>
> Best Regards,
> -Steve
>
> ______________________________________________
> [email protected] mailing list
> https://stat.ethz.ch/mailman/listinfo/r-devel

______________________________________________
[email protected] mailing list
https://stat.ethz.ch/mailman/listinfo/r-devel