Hi

for each measurement day we use "lme" for our four repetitions. Now it
would be great if we can represent the error too.
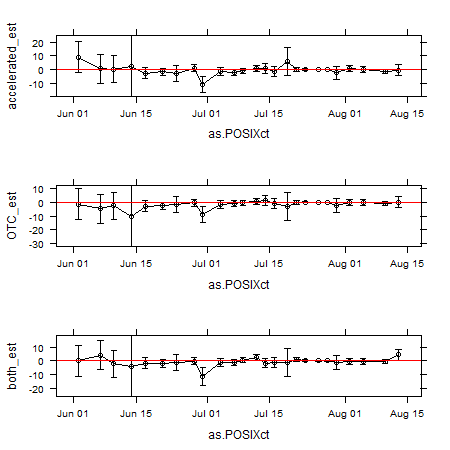
The following seems to be good. Unfortunately, there is not the full
example source code. Maybe someone has done it before.

(from http://anthony.darrouzet-nardi.net/scienceblog/?p=406 )
"Finally, here's a graph of the results for the ammonium data, showing
the mean differences±95%CI between each of our three treatments and the
control"

http://anthony.darrouzet-nardi.net/scienceblog/wp-content/uploads/2011/08/rm_analysis_demo.png

thx
Christof

______________________________________________
[email protected] mailing list
https://stat.ethz.ch/mailman/listinfo/r-help
PLEASE do read the posting guide http://www.R-project.org/posting-guide.html
and provide commented, minimal, self-contained, reproducible code.