I would like to use your genoPlotR package
(doi:10.1093/bioinformatics/btq413) to compare the genomes of two
isolates of E. coli K-12 that I have. One is a K-12 that was in my
lab's fridge; the other is a derivative of K-12 bought some time ago,
HB101.
I tried to use genoPlotR, but I could not understand some functions
from your vignette. I would like to ask you whether you could help me
with this.
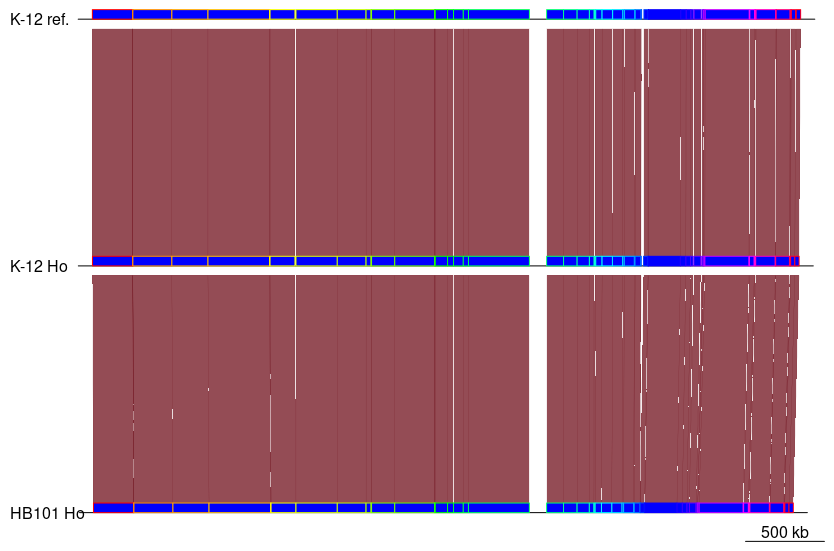
I aligned the genomes (reference K-12 plus my isolates) with
`progressiveMauve --weight=15 --output=./K12_Aln.fa K12_multi.fa`,
where K12_multi.fa contains the fasta sequences of the reference and
the consensuses I obtained from my isolates after Illumina NGS. I then
ran this script:

```
## get data
bbone_file = "./K12_Aln.backbone"
bbone = read_mauve_backbone(bbone_file, ref=2)
names(bbone$dna_segs) = c("K-12 ref.", "K-12 Ho", "HB101 Ho")

## calculate lengths
for (i in 1:length(bbone$comparisons)) {
  cmp = bbone$comparisons[[i]]
  bbone$comparisons[[i]]$length = abs(cmp$end1 - cmp$end1) +
                                  abs(cmp$end2 - cmp$end2)
}

## plot
plot_gene_map(dna_segs = bbone$dna_segs,
              comparisons = bbone$comparisons,
              global_color_scheme = c("length", "increasing", "red_blue", 0.7),
              override_color_schemes = TRUE)
```
I got the following plot: https://u.cubeupload.com/Gigiux/Rplot.png
My questions are:
- How can I load the annotations? I have the K-12 annotations in gff3
and genebank formats, but how do I load them in the system so that I
plot it here?
- Is it possible to zoom in?
- Is it possible to change the color scheme?
Thank you


--
Best regards,
Luigi

______________________________________________
R-help@r-project.org mailing list -- To UNSUBSCRIBE and more, see
https://stat.ethz.ch/mailman/listinfo/r-help
PLEASE do read the posting guide http://www.R-project.org/posting-guide.html
and provide commented, minimal, self-contained, reproducible code.