Hi,
For a good discussion of the link between colour and spectra I would
suggest,
http://www.fourmilab.ch/documents/specrend/
which provides an open-source C code to perform the conversion you ask
for. I asked for some advice on how to wrap a R function around this
code last week but sadly I didn't get anywhere. Do let me know if you
succeed. (alternatively, one could port the implementation in pure R
as the code is not too complicated or computationally demanding).
Hope this helps,

baptiste


On 14 Mar 2009, at 12:09, Jinsong Zhao wrote:
Hi there,
I try to plot visible light spectrum (380nm~780nm) with color
corresponding to the specific wavelength. However, I don't find a
function that could do this.
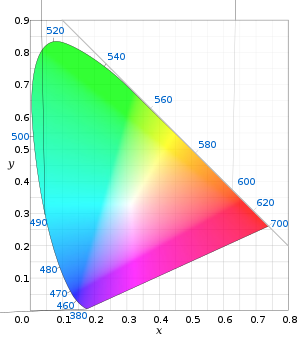
Another question, it's possible to plot a color space chromaticity
diagram like this:
http://upload.wikimedia.org/wikipedia/commons/thumb/0/02/CIExy1931.svg/300px-CIExy1931.svg.png
Thanks in advance!
Jinsong
______________________________________________
R-help@r-project.org mailing list
https://stat.ethz.ch/mailman/listinfo/r-help
PLEASE do read the posting guide http://www.R-project.org/posting-guide.html
and provide commented, minimal, self-contained, reproducible code.
_____________________________

Baptiste Auguié

School of Physics
University of Exeter
Stocker Road,
Exeter, Devon,
EX4 4QL, UK

Phone: +44 1392 264187

http://newton.ex.ac.uk/research/emag

______________________________________________
R-help@r-project.org mailing list
https://stat.ethz.ch/mailman/listinfo/r-help
PLEASE do read the posting guide http://www.R-project.org/posting-guide.html
and provide commented, minimal, self-contained, reproducible code.