Philippe wrote:
 > You should use ImageJ to binarize the picture and then extract features
 > (measurements) for each blob (individual). Save results as a text file and
 > import it in R (read.table). There you have plenty of packages to analyze
 > and classify your data. Things to try range from classical lda, to learning
 > vector quantization or neural nets (bundle VR), support vector machine
 > (package e1071) bagging (package ipred) and random forest (package
 > randomForest), among others.
 >
 > Otherwise, I work on a similar subject: I study methods for (semi)-automatic
 > recognition of plancton based on the analysis of digitized pictures. A
 > reference: Grosjean, Ph., M. Picheral, C. Warembourg & G. Gorsky, 2004.
 > Enumeration, measurement and identification of net zooplankton samples using
 > the ZOOSCAN digital imaging system. ICES J. Mar. Sci., 61:518-525. If you
 > are interested, contact me on my private email box.
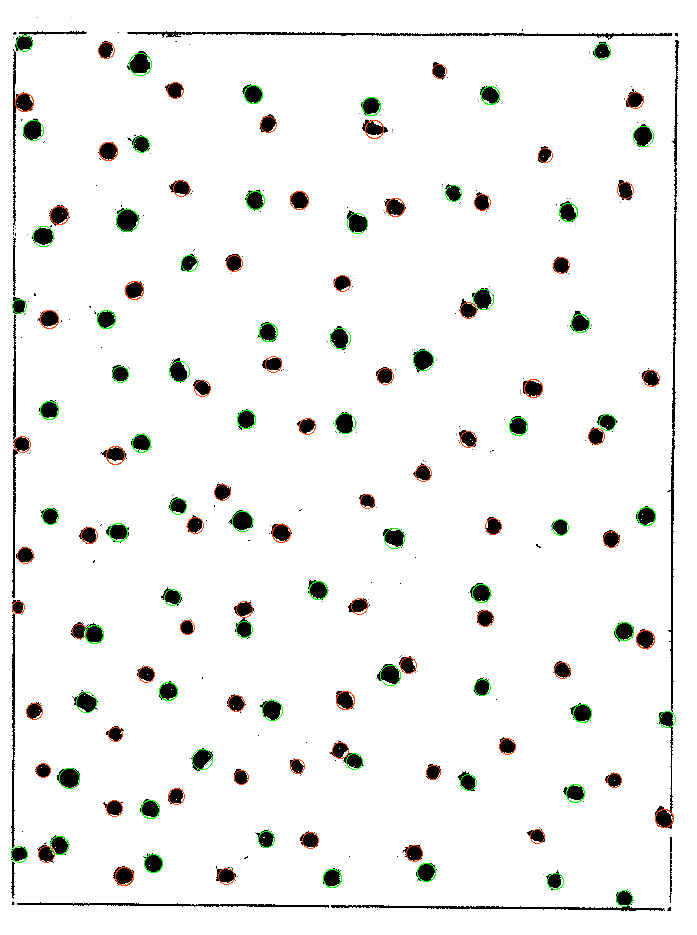
Angel wrote:
 > > I have some images of bugs (insects) with many bugs in each image.
 > > I want to count the number of bugs and to have an estimate of
 > > the area of each one.
 > > I've tried searching for an R package to do so with no
 > > success. Is this a task that I should pursue doing in R or
 > > should I restrict myself to specific image analysis software
 > > (e.g. ImageJ)?.
 > >
 > > The reason I consider R would be a good choice is because
 > > then It would probably be possible to use R statistical power
 > > to do pattern recognition on each bug's image to try to
 > > identify each bug (Family, genus or species).
 > > Is anybody working in this direction?

I wrote some code recently to do simple image analysis in R, not going
as far as Image J.  But you can see the process at:
  http://www.anc.ed.ac.uk/~stephen/data/mosaics/w81_scan/w81s1.html

e.g. In the following image:

http://www.anc.ed.ac.uk/~stephen/data/mosaics/w81_scan/w81s1_check2.png

each "blob" is a neural cell, and I've used simple image processing to
find each region in a binarized image, find its centre and area; the
cell is then approximated as a circle of equivalent radius (R has
drawn the red/green circles on top of the original image, the colour
has been hand selected by me, not the the program.).

This uses the pixmap package to read in PGM files and then some C code
to find the regions.  You could build on this by extracting other
features from each region, but if ImageJ already does most of the hard
work, you might well stick with that rather than take this approach.

My code is not yet clean, but if others wanted to see it, I can pass
it on.  (I also have some 2-d convolution code since we are on the
topic of image processing).  Contact me off-list.

best wishes,
Stephen

______________________________________________
[EMAIL PROTECTED] mailing list
https://stat.ethz.ch/mailman/listinfo/r-help
PLEASE do read the posting guide! http://www.R-project.org/posting-guide.html