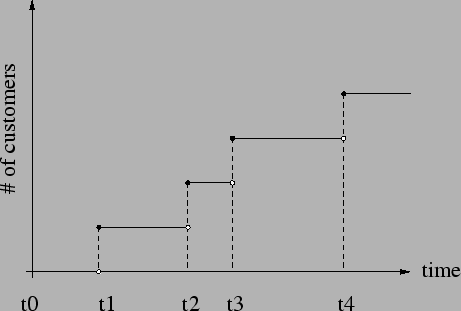
Thank you for your advice, but this is not the exaxt thing i'm looking for
http://robotics.caltech.edu/~zoran/Research/poisson/img1.png
this picture gives an example what i want to get. instead of t0, t1,
t2,.... i want to draw my dates.
In my description i forgot the the horizontal line, which indicates the
time between two dates each, sorry for that.
regards
andreas


Dieter Menne wrote:

> <voodooochild <at> gmx.de> writes:
>
>
>
>>i want to plot a count process in the following way, but i don't know
>>how i can do that. i have data for example x<-(0,2,6,2,8,4,.....) and
>>dates y which is a vector of weekly dates for example
>>(01/01/06, 08/01/06, 15/01/06, 22/01/06, ....), now i want to plot the
>>y's an the horizontal axis. On each date the count process jumps upwards
>>1 unit, so the vertical axis is 0, 1, 2, 3, ......
>>the distance between the dates is shown in vector x, so for example the
>>distance between 08/01/06 and 15/01/06 should be 2. maybe i can use some
>>times series functions for doing this?
>>
>>
>>
>
>If I understand you correctly, this means plotting equidistant point against
>the cumulative sum. Forgetting about the dates now, this would do it.
>
>x = floor(pmax(rnorm(30,5,2),1))
>xcum = cumsum(x)
>plot(xcum,1:30)
>
>Dieter
>
>______________________________________________
>[email protected] mailing list
>https://stat.ethz.ch/mailman/listinfo/r-help
>PLEASE do read the posting guide! http://www.R-project.org/posting-guide.html
>
>
>
>

______________________________________________
[email protected] mailing list
https://stat.ethz.ch/mailman/listinfo/r-help
PLEASE do read the posting guide! http://www.R-project.org/posting-guide.html