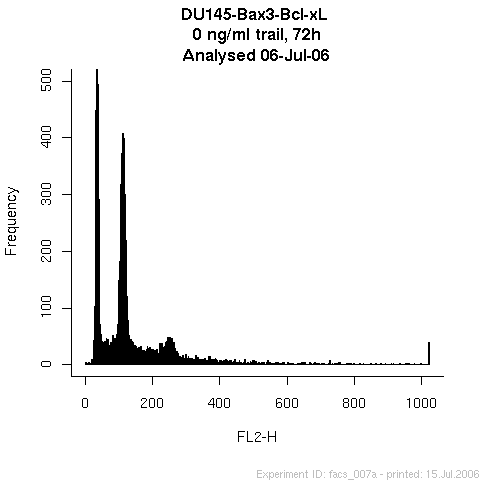
Hello all,

I have some histograms of amount of DNA in some cells (DU145 cells
overexpressing Bax and Bcl-xL for those who wish to know). The histograms
show not only two peaks as expected, but three, indicating that some cells
have more than normal amounts of DNA.
I am interested in knowing how much of the cell populations are in each peak
as well as between.

I am not really sure how to go about it; I have been considering fitting a
gaussian distribution to each peak and integrate the part between the peaks
as described by Watson et al (1987 Cytometry 8:1-8). A more straight forward
and more visual approach appears to be plotting the cumulative frequencies.
In either case, I should like to find the peaks in the histogram
automatically, as well as getting proper information about the peaks.

How would I go about finding peaks using R? Also I have really not been able
to figure out how to fit a distribution.

Is there a way to analyse the cumulative frequencies? the knots() function
appears to return far too many knots.

I am relatively new to R, but do have good programming experience, though I
am mostly biologist.

Thank you in advance for any inputs.

PS. An example of the histogram can be found
here<http://photos1.blogger.com/blogger/7029/2724/1600/DU145-Bax3-Bcl-xL.png>

        [[alternative HTML version deleted]]

______________________________________________
R-help@stat.math.ethz.ch mailing list
https://stat.ethz.ch/mailman/listinfo/r-help
PLEASE do read the posting guide! http://www.R-project.org/posting-guide.html