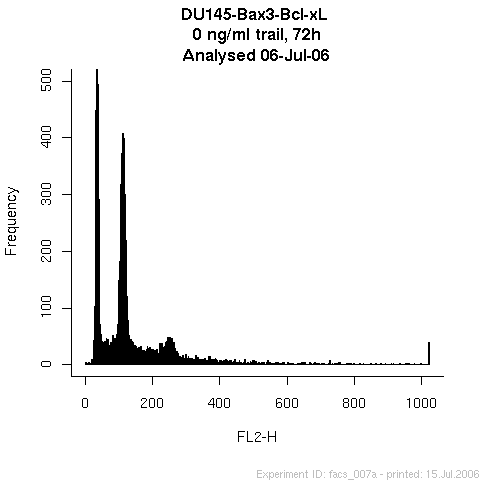
> I would like to fit a distribution to each of the peaks in a histogram, such
> as this:
> http://photos1.blogger.com/blogger/7029/2724/1600/DU145-Bax3-Bcl-xL.png
As a first shot, I'd try fitting a mixture of gamma distributions (say
3), plus a constant term for the highest bin.  You could do this using
ML.  If the number of peaks is truly unknown, this will be a little
trickier but still possible and you could use the LRT to chose between
them.

> Integrate the area between each two peaks, using the means and widths of the
> distributions fitted to the two peaks. I will be using the integrate
> function

Why do you want to do this?

>
> The histogram is based on approximately 15000 events, which makes Mclust and
> pam (which both delivers the information I need) less useful.

If you have unbinned data, it would be better (more precise/powerful)
to use that.

Regards,

Hadley

______________________________________________
[email protected] mailing list
https://stat.ethz.ch/mailman/listinfo/r-help
PLEASE do read the posting guide http://www.R-project.org/posting-guide.html
and provide commented, minimal, self-contained, reproducible code.