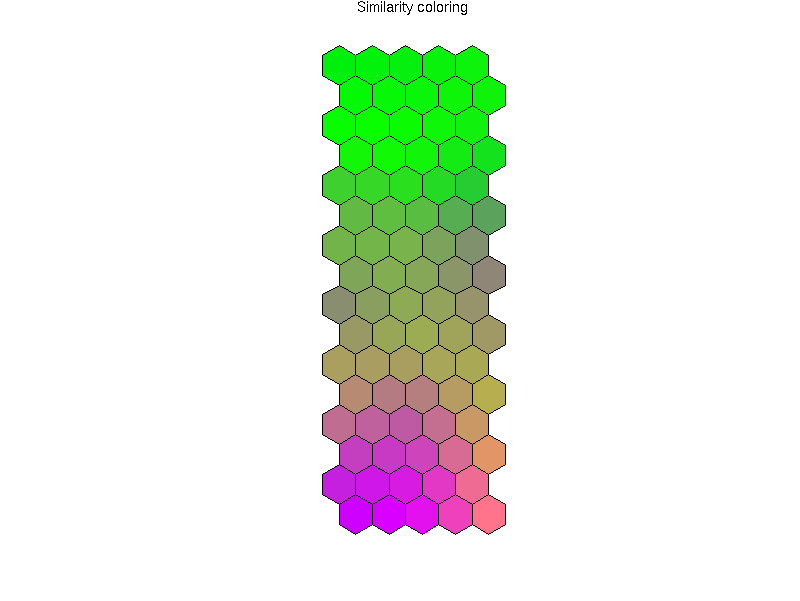
This figure is the plot of prototype of a Self Organizing Maps(SOM)
result.The numeric data is a M*N matrix, M rows and N
columns.color2D.matplot can transform the numeric matrix to a color matrix
,but i have to put them  in  hexagon cells to reveal their topological
structure( M  hexagon cells in a column,N  hexagon cells in a row).
It seems that i have to use the GRID package in R.

On 8/8/06, Jim Lemon <[EMAIL PROTECTED]> wrote:
>
> Jiantao Shi wrote:
> > Hi,
> > i want to plot figure like this,
> >
> http://www.cis.hut.fi/projects/somtoolbox/download/pics2/shotvs2_colorcode.png
> > So is there a function or package in R can help me to do this.
> >
> color2D.matplot transforms a numeric matrix into a color matrix, as does
> "image". I don't know of an R function that does hexagon cells, although
> it wouldn't be impossible to program. What is the numeric data behind
> such a plot?
>
> Jim
>

        [[alternative HTML version deleted]]

______________________________________________
[email protected] mailing list
https://stat.ethz.ch/mailman/listinfo/r-help
PLEASE do read the posting guide http://www.R-project.org/posting-guide.html
and provide commented, minimal, self-contained, reproducible code.