Dear useRs,

While exploring new R packages, I have found the Rattle.
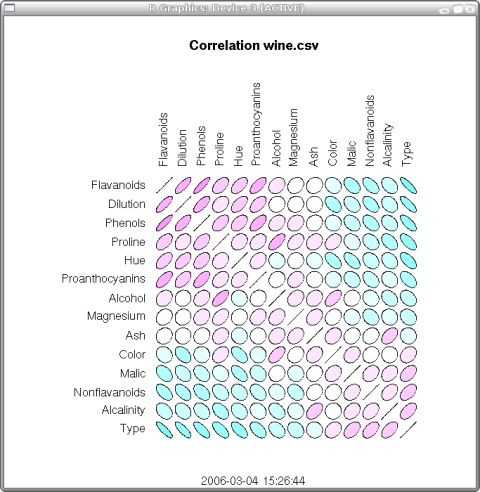
This screenshot http://rattle.togaware.com/rattle-correlation.png
is very interesting
(others are in http://rattle.togaware.com/rattle-screenshots.html ).
Which function was used to produce this plot?
Is such plotting of the correlation matrix a unique Rattle's feature?

Unfortunately I have some weird problems with RGtk2 package and
therefore cannot run Rattle.

I have sent the question about this problem to the maintainer of the
RGtk2 a few hours ago.

When I try to load library(RGtk2) I get the message
"The procedure entry point atk_relation_add_target could not be located
in the dynamic link library libatk-1.0-0.dll".

---
Best regards,
Vladimir                mailto:[EMAIL PROTECTED]

______________________________________________
[email protected] mailing list
https://stat.ethz.ch/mailman/listinfo/r-help
PLEASE do read the posting guide http://www.R-project.org/posting-guide.html
and provide commented, minimal, self-contained, reproducible code.