Hi
I'm working with some historical data on determinations of longitude
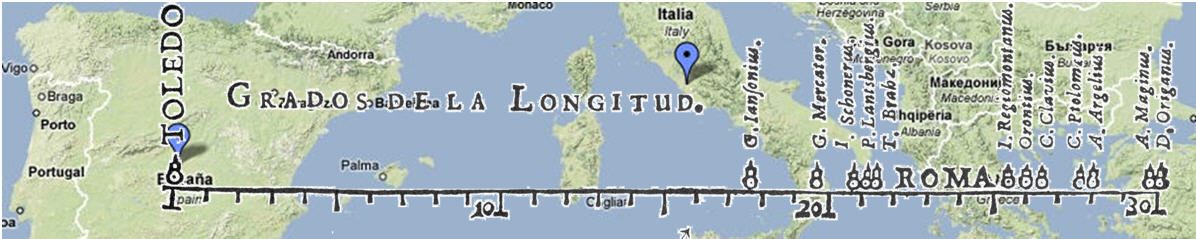
used by Michael F van Langren
in 1644 to draw what is believed to be the first graph of statistical
data. The values are estimates
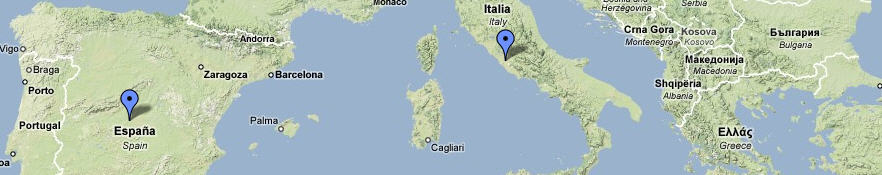
of the distance in longitude between Toledo and Rome.
G. Iansonius 17.736 1501 Jan Jansson Flanders
[1588-1664] sb:~ 1615
G. Mercator       19.872  1567  Gerardus Mercator        Flanders
I. Schonerus      20.638  1536  Johann Schöner           Germany
P. Lantsbergius   21.106  1530  Phillip van Lansberge    Belgium
T. Brahe          21.447  1578  Tycho Brahe              Denmark
I. Regiomontanus 25.617 1471 Johann Muller Germany
[1436-1476] sb: 1463
Orontius 26.000 1542 Oronce Finé France
[1494-1555]
C. Clavius 26.340 1567 Christoph Clavius Germany
C. Ptolomeus 27.787 150 Claudius Ptolemaeus Alexandria
A. Argelius 28.170 1610 Andrea Argoli Italy
sb: 1610
A. Maginus        29.787  1582  Giovanni Antonio Magini  Italy
D. Origanus       30.128  1601  David Origanus           Germany

I want to show these overlaid on a map, something like the following:

http://euclid.psych.yorku.ca/SCS/Gallery/images/Private/Langren/langren-google-overlay.jpg

using *either* a jpeg image,
http://euclid.psych.yorku.ca/SCS/Gallery/images/Private/Langren/google-toledo-rome3.jpg
or a comparable portion of the world map, something like

# approximate coordinates of the BBox of this map
bbox <- c( 38.186, -9.184,
          43.692, 28.674 )
bbox <- matrix(bbox, 2, 2, byrow=TRUE)
map("world", xlim=bbox[,2], ylim=bbox[,1], fill=TRUE, col=colors())
map.axes()
I created the overlay by manually rescaling and calibrating his graph
with a portion of a Google map.
But I'd like to be able to do this more exactly in R, possibly using
other data.
I can read in the data as follows:
langren <-
read.csv("http://euclid.psych.yorku.ca/SCS/Gallery/Private/langrens.csv";,
header=TRUE)
# Lat/Long of Toledo & Rome, from Google map

toledo <- c(39.86, -4.03)
rome   <- c(41.89, 12.5)

# locations of the estimates, converted to lat, long
locations <- cbind( rep(rome[1], 12), toledo[2] + langren$long)
rownames(locations) <- langren$name
locations <- rbind( toledo, locations)
colnames(locations) <- c("lat", "long")

The above steps give:

locations <-
structure(c(39.86, 41.89, 41.89, 41.89, 41.89, 41.89, 41.89,
41.89, 41.89, 41.89, 41.89, 41.89, 41.89, -4.03, 13.706, 15.842,
16.608, 17.076, 17.417, 21.587, 21.97, 22.31, 23.757, 24.14,
25.757, 26.098), .Dim = c(13L, 2L), .Dimnames = list(c("toledo",
"G. Iansonius", "G. Mercator", "I. Schonerus", "P. Lantsbergius",
"T. Brahe", "I. Regiomontanus", "Orontius", "C. Clavius", "C. Ptolomeus",
"A. Argelius", "A. Maginus", "D. Origanus"), c("lat", "long")))

I can also read the .jpg Google map image, at least from a local file:

# read the google image
library(rimage)
gimage <-
read.jpeg("C:/Documents/milestone/images/vanLangren/google-toledo-rome3.jpg")
#gimageloc <-
"http://euclid.psych.yorku.ca/SCS/Gallery/images/Private/Langren/google-toledo-rome3.jpg";
#dest <- paste(tempfile(),'.jpg', sep='')
#download.file(gimageloc, dest)
#  why doesn't this work?
#gimage <- read.jpeg(dest)

plot(gimage)
# approx pixel coordinates of Toledo and Rome in the image, measured
from the *top left* corner as (0,0)
toledo.map <- c(130, 119)
rome.map <-(505, 59)
Here's where I'm stumped. How can I recreate a version of van Langren's
graph shown on top of
either the gimage or on top of the portion of the R world map?

thanks
-Michael

--
Michael Friendly Email: friendly AT yorku DOT ca
Professor, Psychology Dept.
York University      Voice: 416 736-5115 x66249 Fax: 416 736-5814
4700 Keele Street    http://www.math.yorku.ca/SCS/friendly.html
Toronto, ONT  M3J 1P3 CANADA

_______________________________________________
R-sig-Geo mailing list
[email protected]
https://stat.ethz.ch/mailman/listinfo/r-sig-geo