CritasWang commented on code in PR #551:
URL: https://github.com/apache/iotdb-docs/pull/551#discussion_r1955709122
########## src/zh/UserGuide/Master/Table/Tools-System/Monitor-Tool_apache.md: ########## @@ -0,0 +1,170 @@ +<!-- + + Licensed to the Apache Software Foundation (ASF) under one + or more contributor license agreements. See the NOTICE file + distributed with this work for additional information + regarding copyright ownership. The ASF licenses this file + to you under the Apache License, Version 2.0 (the + "License"); you may not use this file except in compliance + with the License. You may obtain a copy of the License at + + http://www.apache.org/licenses/LICENSE-2.0 + + Unless required by applicable law or agreed to in writing, + software distributed under the License is distributed on an + "AS IS" BASIS, WITHOUT WARRANTIES OR CONDITIONS OF ANY + KIND, either express or implied. See the License for the + specific language governing permissions and limitations + under the License. + +--> + + +# Prometheus + +监控工具的部署可参考文档 [监控面板部署](../Deployment-and-Maintenance/Monitoring-panel-deployment.md) 章节。 + +## 监控指标的 Prometheus 映射关系 + +> 对于 Metric Name 为 name, Tags 为 K1=V1, ..., Kn=Vn 的监控指标有如下映射,其中 value 为具体值 + +| 监控指标类型 | 映射关系 | +| ---------------- |--------------------------------| +| Counter | name_total{cluster="clusterName", nodeType="nodeType", nodeId="nodeId",k1="V1" , ..., Kn="Vn"} value | +| AutoGauge、Gauge | name{cluster="clusterName", nodeType="nodeType", nodeId="nodeId",k1="V1" , ..., Kn="Vn"} value | +| Histogram | name_max{cluster="clusterName", nodeType="nodeType", nodeId="nodeId",k1="V1" , ..., Kn="Vn"} value <br> name_sum{cluster="clusterName", nodeType="nodeType", nodeId="nodeId",k1="V1" , ..., Kn="Vn"} value <br> name_count{cluster="clusterName", nodeType="nodeType", nodeId="nodeId",k1="V1" , ..., Kn="Vn"} value <br> name{cluster="clusterName", nodeType="nodeType", nodeId="nodeId",k1="V1" , ..., Kn="Vn", quantile="0.5"} value <br> name{cluster="clusterName", nodeType="nodeType", nodeId="nodeId",k1="V1" , ..., Kn="Vn", quantile="0.99"} value | +| Rate | name_total{cluster="clusterName", nodeType="nodeType", nodeId="nodeId",k1="V1" , ..., Kn="Vn"} value <br> name_total{cluster="clusterName", nodeType="nodeType", nodeId="nodeId",k1="V1" , ..., Kn="Vn", rate="m1"} value <br> name_total{cluster="clusterName", nodeType="nodeType", nodeId="nodeId",k1="V1" , ..., Kn="Vn", rate="m5"} value <br> name_total{cluster="clusterName", nodeType="nodeType", nodeId="nodeId",k1="V1" , ..., Kn="Vn", rate="m15"} value <br> name_total{cluster="clusterName", nodeType="nodeType", nodeId="nodeId",k1="V1" , ..., Kn="Vn", rate="mean"} value | +| Timer | name_seconds_max{cluster="clusterName", nodeType="nodeType", nodeId="nodeId",k1="V1" , ..., Kn="Vn"} value <br> name_seconds_sum{cluster="clusterName", nodeType="nodeType", nodeId="nodeId",k1="V1" , ..., Kn="Vn"} value <br> name_seconds_count{cluster="clusterName", nodeType="nodeType", nodeId="nodeId",k1="V1" , ..., Kn="Vn"} value <br> name_seconds{cluster="clusterName", nodeType="nodeType", nodeId="nodeId",k1="V1" , ..., Kn="Vn", quantile="0.5"} value value <br> name_seconds{cluster="clusterName", nodeType="nodeType", nodeId="nodeId",k1="V1" , ..., Kn="Vn", quantile="0.99"} value | + +## 修改配置文件 + +1) 以 DataNode 为例,修改 iotdb-system.properties 配置文件如下: + +```properties +dn_metric_reporter_list=PROMETHEUS +dn_metric_level=CORE +dn_metric_prometheus_reporter_port=9091 +``` + +2) 启动 IoTDB DataNode + +3) 打开浏览器或者用```curl``` 访问 ```http://servier_ip:9091/metrics```, 就能得到如下 metric 数据: + +``` +... +# HELP file_count +# TYPE file_count gauge +file_count{name="wal",} 0.0 +file_count{name="unseq",} 0.0 +file_count{name="seq",} 2.0 +... +``` + +## Prometheus + Grafana + +如上所示,IoTDB 对外暴露出标准的 Prometheus 格式的监控指标数据,可以使用 Prometheus 采集并存储监控指标,使用 Grafana +可视化监控指标。 + +IoTDB、Prometheus、Grafana三者的关系如下图所示: + +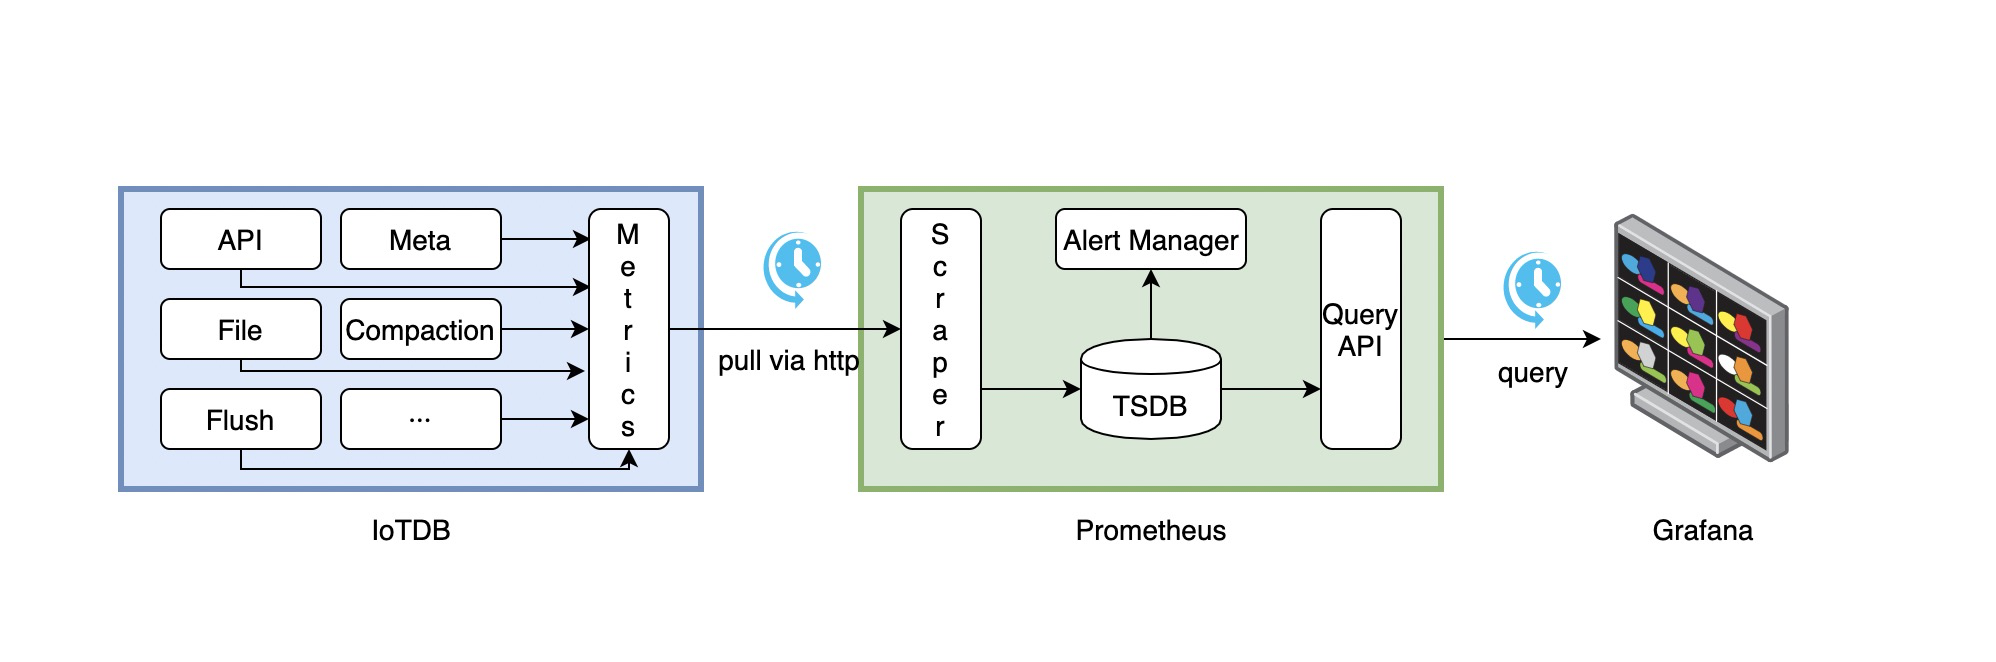 Review Comment: 所有图片要引用本地,先 rebase 下 master 吧 -- This is an automated message from the Apache Git Service. To respond to the message, please log on to GitHub and use the URL above to go to the specific comment. To unsubscribe, e-mail: [email protected] For queries about this service, please contact Infrastructure at: [email protected]