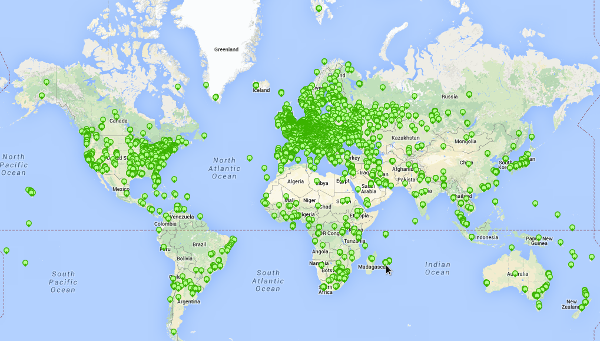
Hello,

What happened to the probe coverage map that showed number of probes
at different level of details depending on the zoomed-in state of
the map? — I have an earlier screenshot [a] (2015) to explain what
I mean. It was a very nice plot.
[a] http://i.imgur.com/d0tI1qP.png

I was looking for a probe coverage map to put in one of my slides.
I ended up using [b], but I miss [a].

[b]
https://www-static.ripe.net/static/rnd-ui/atlas/static/page/img/allprobes.png

Best, Vaibhav

===================================
Vaibhav Bajpai
www.vaibhavbajpai.com

Room 91, Research I
School of Engineering and Sciences
Jacobs University Bremen, Germany
===================================
![]() signature.asc
signature.asc
Description: Message signed with OpenPGP using GPGMail