William R. Lorenz wrote:
> Hi All,
>
> I'm looking to create a graph similar to --
>
>    http://oss.oetiker.ch/rrdtool/gallery/panel_user.png
>
> with red/green coloring depending on when something is online or offline.
> Can someone help provide a high-level overview as to which rrdtool graph
> commands/options I should be looking at to accomplish the red/green shade?
>
> Just a pointer in the right direction so I can RTM would help a lot.
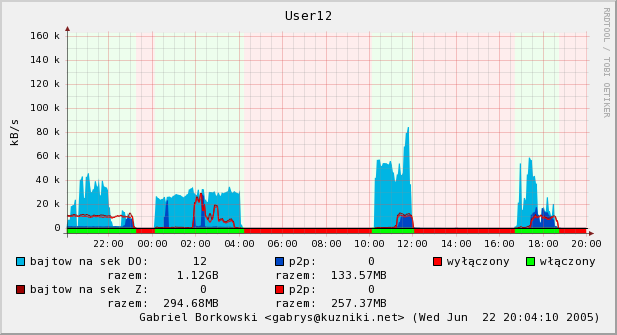
Wiliam,

to graph to the top(bottom) edge of the canvas you need a value of +(-)inf.

ex.

DEF:temp=some.rrd:temp:AVERAGE
DEF:onoff=some.rrd:onoff:LAST
CDEF:back=onoff,INF,*         # if onoff != 0 this will be INF, otherwise 0
AREA:back#ff000020            # add 4th color value for transparency
LINE1:temp#0000ff

If you want red(off)/green(on), this will look like:

DEF:temp=some.rrd:temp:AVERAGE
DEF:onoff=some.rrd:onoff:LAST
CDEF:red=onoff,0,EQ,INF,0,IF  # if onoff == 0 this will be INF, otherwise 0
CDEF:green=onoff,INF,*        # if onoff != 0 this will be INF, otherwise 0
AREA:red#ff000020             # add 4th color value for transparency
AREA:green#00ff0020           # add 4th color value for transparency
LINE1:temp#0000ff

Of course you can make this depending of some value, eq:

CDEF:red=temp,50,LT,0,INF,IF
CDEF:green=temp,50,LT,INF,0,IF

haven't tested it, but unless there's a typo it should work.

hth

- Karl

_______________________________________________
rrd-users mailing list
[email protected]
https://lists.oetiker.ch/cgi-bin/listinfo/rrd-users