Thanks for the response! I'm wondering what this term prediction means then. I
took it as prediction of future data points based on previous data points and
trends. I've also read that prediction, as it is used in RRDtool, could also
mean prediction of possible issues based on current trends.
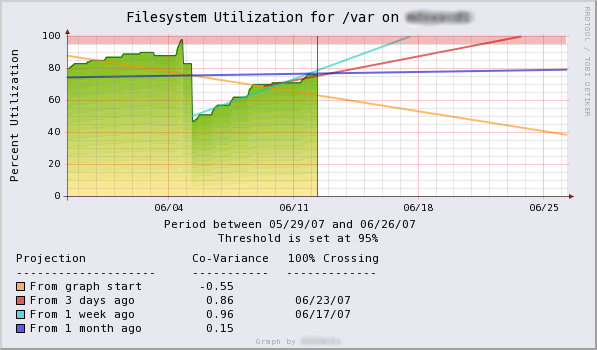
I was playing around with the Google Visualization API as a weekend project and
noticed that this gadget
(http://www.google.com/ig/directory?url=customer.eivia.com/gadgets/forecast.cgi
) is using Holt-Winters, along with other algorithms, to best fit the data and
make a prediction. Is it possible to predict future values based on past data
points with the RRDtool implementation of Holt-Winters?

Thanks,
Faraaz

On Tue, Aug 18, 2009 at 01:43:00PM -0700, Faraaz Sareshwala wrote:

> I have drawn the hwpredict line on the graphs, some confidence bands,
> and tick data from the failures rra. However, I am looking to do
> something like what is shown in this graph on the RRDtool gallery:
> http://oss.oetiker.ch/rrdtool/gallery/fsu_predict.png. Can the
> Holt-Winters algorithm as it is implemented in RRDtool provide this
> sort of prediction? If so, can someone provide some guidance on how to
> go about doing that? If not, how is it being done in that graph?


I don't think those graphs have anything to do with holt-winters.  I'm
assuming they're simple least-squares linear fits to the data.

I tried recreating them a bit.  Haven't done anything new since this post:
<https://lists.oetiker.ch/pipermail/rrd-users/2008-March/013819.html>

Good luck.

--
Darren

_______________________________________________
rrd-users mailing list
[email protected]
https://lists.oetiker.ch/cgi-bin/listinfo/rrd-users
_______________________________________________
rrd-users mailing list
[email protected]
https://lists.oetiker.ch/cgi-bin/listinfo/rrd-users