Hi Daniel,

Today Daniel MacKay wrote:
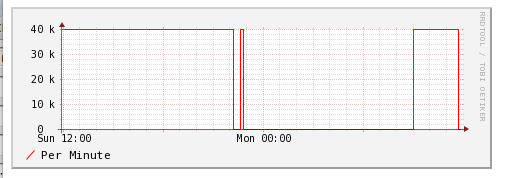
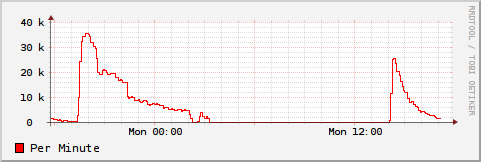
> Ahahah good luck with the unsubscribes there, guys.
>
> Does anyone have any suggestion about where I should look for the problem
> behind these "square" shape graphs?
>
> Here's the data that produced it:
>
> http://bonmot.ca/~daniel/tmp/oas_log___oas_log.rrd
> http://bonmot.ca/~daniel/tmp/oas_log___oas_log.xml
>
> ... and here's the command I used on it:
>
> rrdtool graph test.png
> DEF:permin=/usr/local/nagios/nagiosgraph/rrd/app07/oas_log___oas_log.rrd:permin:AVERAGE
>  'LINE:permin#ff0000:Per Minute'
>
> ...  and here's the resulting graph:
>
> http://gyazo.com/6e4a0ebad7a5e6e0b83753aca8b9533e.png
>
> you can see that it only shows either zero or the maximum value.
>
> Please, any suggestions for hunting for this would be most welcomed.  Here's
> my version:
>
> > RRDtool 1.4.2  Copyright 1997-2009 by Tobias Oetiker <[email protected]>
> >               Compiled Mar 21 2010 21:38:56

I just restored your data with rrdtool 1.4.3 and drew the graph ...
http://tobi.oetiker.ch/test/test.png  looks all pretty normal ...

are you sure the graph comandline is what you quoted above ?

cheers
tobi

>
> _______________________________________________
> rrd-users mailing list
> [email protected]
> https://lists.oetiker.ch/cgi-bin/listinfo/rrd-users
>
>

--
Tobi Oetiker, OETIKER+PARTNER AG, Aarweg 15 CH-4600 Olten, Switzerland
http://it.oetiker.ch [email protected] ++41 62 775 9902 / sb: -9900

_______________________________________________
rrd-users mailing list
[email protected]
https://lists.oetiker.ch/cgi-bin/listinfo/rrd-users