[GitHub] skyfeiz opened a new issue #8244: 2D世界地图无数据地区label无法改成中文
skyfeiz opened a new issue #8244: 2D世界地图无数据地区label无法改成中文
URL: https://github.com/apache/incubator-echarts/issues/8244


   问题参考官网链接
   http://echarts.baidu.com/examples/editor.html?c=map-world
   日期2018/04/28
   ### One-line summary [问题简述]
   需求:世界地图地区改成中文名称;

方法:通过label中formatter函数修改返回值来实现,但通过实验,label不管放到哪里,formatter函数只会在series中设置了数据的地区调用,其他无数据的地区(没有在series中写入)不会调用formatter,地区名称显示没有修改的英文名称。
   测试版本 4.0.3  ,
   ### Version & Environment [版本及环境]
   + ECharts version [ECharts 版本]:
   + Browser version [浏览器类型和版本]:
   + OS Version [操作系统类型和版本]:


   ### Expected behaviour [期望结果]
   期望echarts越来越好。


   ### ECharts option [ECharts配置项]


   ```javascript
   option = {

   }

   ```


   ### Other comments [其他信息]


This is an automated message from the Apache Git Service.
To respond to the message, please log on GitHub and use the
URL above to go to the specific comment.

For queries about this service, please contact Infrastructure at:
us...@infra.apache.org


With regards,
Apache Git Services

-
To unsubscribe, e-mail: dev-unsubscr...@echarts.apache.org
For additional commands, e-mail: dev-h...@echarts.apache.org
[GitHub] zhuchen320 opened a new issue #8243: echarts 100%宽变为100px如何重新渲染
zhuchen320 opened a new issue #8243: echarts 100%宽变为100px如何重新渲染
URL: https://github.com/apache/incubator-echarts/issues/8243


   ### One-line summary [问题简述]
   tab切换之后echarts的百分比宽高变为固定px值,显示不全无法获得正确宽高


   ### Version & Environment [版本及环境]
   + ECharts version [ECharts 版本]:
   + Browser version [浏览器类型和版本]:
   + OS Version [操作系统类型和版本]:


   ### Expected behaviour [期望结果]
   tab切换echarts能够正确渲染


   ### ECharts option [ECharts配置项]


   ```javascript
   option = {
   tooltip: {
   trigger: 'item',
   backgroundColor: 'rgba(88, 100, 117, .9)',
   // formatter: "{b}: {c} ({d}%)"
 },
 grid: {
   left: '3%',
   right: '4%',
   bottom: '3%',
   containLabel: true
 },
 legend: {
   itemGap: 70,
   data:[
 {
   name: '直接委托',
   icon: 'circle'
 },
 {
   name: '招投标项目',
   icon: 'circle'
 }
   ]
 },
 series: [
   {
 type:'pie',
 radius: ['35%', '60%'],
 avoidLabelOverlap: false,
 label: {
   normal: {
 position: 'inner',
 formatter: '{d}%',
 textStyle: {
   color: '#fff',
   fontWeight: 'bold',
   fontSize: 14
 }
   }
 },
 labelLine: {
   normal: {
 show: false
   }
 },
 data:[
   {
 value: 12000,
 name:'直接委托',
 itemStyle: {
   color: '#2F82BE'
 }
   },
   {
 value: 8000,
 name:'招投标项目',
 itemStyle: {
   color: '#BDECF8'
 }
   }
 ]
   }
 ]
   }

   ```


   ### Other comments [其他信息]


This is an automated message from the Apache Git Service.
To respond to the message, please log on GitHub and use the
URL above to go to the specific comment.

For queries about this service, please contact Infrastructure at:
us...@infra.apache.org


With regards,
Apache Git Services

-
To unsubscribe, e-mail: dev-unsubscr...@echarts.apache.org
For additional commands, e-mail: dev-h...@echarts.apache.org
[GitHub] daniel-lij opened a new issue #8242: 我在使用ECharts 的gauge的时候设置detail下的fontSize属性发现没用
daniel-lij opened a new issue #8242: 我在使用ECharts
的gauge的时候设置detail下的fontSize属性发现没用
URL: https://github.com/apache/incubator-echarts/issues/8242


   ### One-line summary [问题简述]

   我在使用ECharts 的gauge的时候设置detail下的fontSize属性发现没用,另外我设置了title下的字体属性也没用
   这是我将图床

https://waifu2x.booru.pics/outfiles/c8c04188cd1246ea8b95df1852b514891b740b66_s2_n1.png

   ### Version & Environment [版本及环境]
   + ECharts version [ECharts 版本]: 3.0
   + Browser version [浏览器类型和版本]: 版本 66.0.3359.117(正式版本) (64 位)
   + OS Version [操作系统类型和版本]: windows 10 家庭版


   ### Expected behaviour [期望结果]

   我期望能够解答我的问题,关键的事我在官网上测试是没问题的


   ### ECharts option [ECharts配置项]


   ```javascript
   option = {
tooltip : {
   formatter: "{a} {b} : {c}%"
   },
   series: [
   {
   name: '超期处置率',
   type: 'gauge',
   center: ["50%", "55%"],
   title : {
   fontWeight: 'bolder',
   fontSize: 30
   },
   pointer: {
   show: true,
   length: '65%',
   width: 4
   },
   detail: {
   formatter:'{value}%',
   fontSize:10
   },
   axisLine: {// 坐标轴线
   lineStyle: {   // 属性lineStyle控制线条样式
   color: [[0.2, '#91c7ae'], [0.8, '#63869e'],
[1,'#c23531']],
   width: 10
   }
   },
   splitLine:{
   length: 10
   },
   radius: '105%',
   data: data
   }
   ]
   }

   ```


   ### Other comments [其他信息]


This is an automated message from the Apache Git Service.
To respond to the message, please log on GitHub and use the
URL above to go to the specific comment.

For queries about this service, please contact Infrastructure at:
us...@infra.apache.org


With regards,
Apache Git Services

-
To unsubscribe, e-mail: dev-unsubscr...@echarts.apache.org
For additional commands, e-mail: dev-h...@echarts.apache.org
Podling Report Reminder - May 2018
Dear podling,

This email was sent by an automated system on behalf of the Apache
Incubator PMC. It is an initial reminder to give you plenty of time to
prepare your quarterly board report.

The board meeting is scheduled for Wed, 16 May 2018, 10:30 am PDT.
The report for your podling will form a part of the Incubator PMC
report. The Incubator PMC requires your report to be submitted 2 weeks
before the board meeting, to allow sufficient time for review and
submission (Wed, May 02).

Please submit your report with sufficient time to allow the Incubator
PMC, and subsequently board members to review and digest. Again, the
very latest you should submit your report is 2 weeks prior to the board
meeting.

Candidate names should not be made public before people are actually
elected, so please do not include the names of potential committers or
PPMC members in your report.

Thanks,

The Apache Incubator PMC

Submitting your Report

--

Your report should contain the following:

*   Your project name
*   A brief description of your project, which assumes no knowledge of
the project or necessarily of its field
*   A list of the three most important issues to address in the move
towards graduation.
*   Any issues that the Incubator PMC or ASF Board might wish/need to be
aware of
*   How has the community developed since the last report
*   How has the project developed since the last report.
*   How does the podling rate their own maturity.

This should be appended to the Incubator Wiki page at:

https://wiki.apache.org/incubator/May2018

Note: This is manually populated. You may need to wait a little before
this page is created from a template.

Mentors
---

Mentors should review reports for their project(s) and sign them off on
the Incubator wiki page. Signing off reports shows that you are
following the project - projects that are not signed may raise alarms
for the Incubator PMC.

Incubator PMC

-
To unsubscribe, e-mail: dev-unsubscr...@echarts.apache.org
For additional commands, e-mail: dev-h...@echarts.apache.org
[GitHub] Diamant024 opened a new issue #8241: Question about multidimensionality
Diamant024 opened a new issue #8241: Question about multidimensionality
URL: https://github.com/apache/incubator-echarts/issues/8241


   ### One-line summary [问题简述]

   ### Version & Environment [版本及环境]
   + ECharts version [ECharts 版本]: 4.0.4
   + Browser version [浏览器类型和版本]: Any
   + OS Version [操作系统类型和版本]: Any

   I have data in next format:

   ```javascript
   [['Product', 'Year', 'Sales'],
   ['Matcha Latte', '2017', 24],
   ['Matcha Latte', '2018', 41],
   ['Milk Tea', '2016', 31],
   ['Milk Tea', '2017', 26],
   ['Milk Tea', '2018', 77]]

   ```

   As you see, there two dimensions and one measure. Can I visualizate it in
Echarts using only one Series?


This is an automated message from the Apache Git Service.
To respond to the message, please log on GitHub and use the
URL above to go to the specific comment.

For queries about this service, please contact Infrastructure at:
us...@infra.apache.org


With regards,
Apache Git Services

-
To unsubscribe, e-mail: dev-unsubscr...@echarts.apache.org
For additional commands, e-mail: dev-h...@echarts.apache.org
[GitHub] angelsaga opened a new issue #8240: series.graph使用 coordinateSystem: 'cartesian2d'时, 无法显示data 和 edges
angelsaga opened a new issue #8240: series.graph使用 coordinateSystem:
'cartesian2d'时, 无法显示data 和 edges
URL: https://github.com/apache/incubator-echarts/issues/8240
### One-line summary [问题简述]
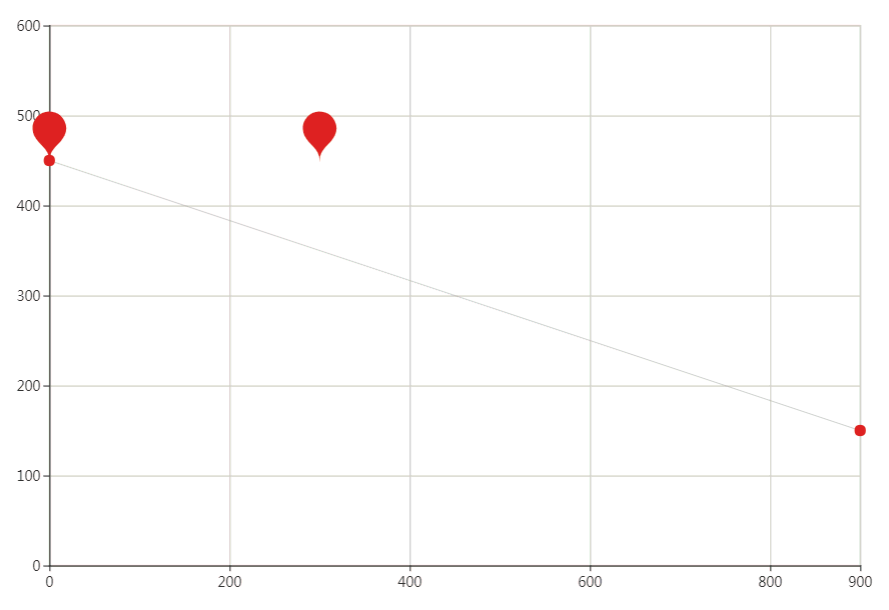
当series中启用coordinateSystem: 'cartesian2d', data 和edges不显示,
注释掉coordinateSystem: 'cartesian2d',后能显示
### Version & Environment [版本及环境]
+ ECharts version [ECharts 版本]: 4.0.4
+ Browser version [浏览器类型和版本]: Chrome Version 67.0.3396.10
+ OS Version [操作系统类型和版本]: win7 X64
### Expected behaviour [期望结果]
### ECharts option [ECharts配置项]
```javascript
option = {
grid:{
show : true
},
xAxis : [
{
show : true,
min: 0,
max: 900
}
],
yAxis : [
{
show : true,
min: 0,
max: 600
}
],
series: [
{
type: 'graph',
layout: 'none',
coordinateSystem: 'cartesian2d',
data: [
{
x: 100,
y: 200,
id: 'A'
},
{
x: 400,
y: 300,
id: 'B'
}
],
edges: [{
source: "A",
target: "B",
emphasis: {
show: true,
color: 'red'
}
}],
markPoint : {
data:[
{
coord: [100, 200],
id: 'A'
},
{
coord: [200, 200],
id: 'B'
}
]
}
]
}
```
### Other comments [其他信息]
//coordinateSystem: 'cartesian2d', 只有markPoint显示
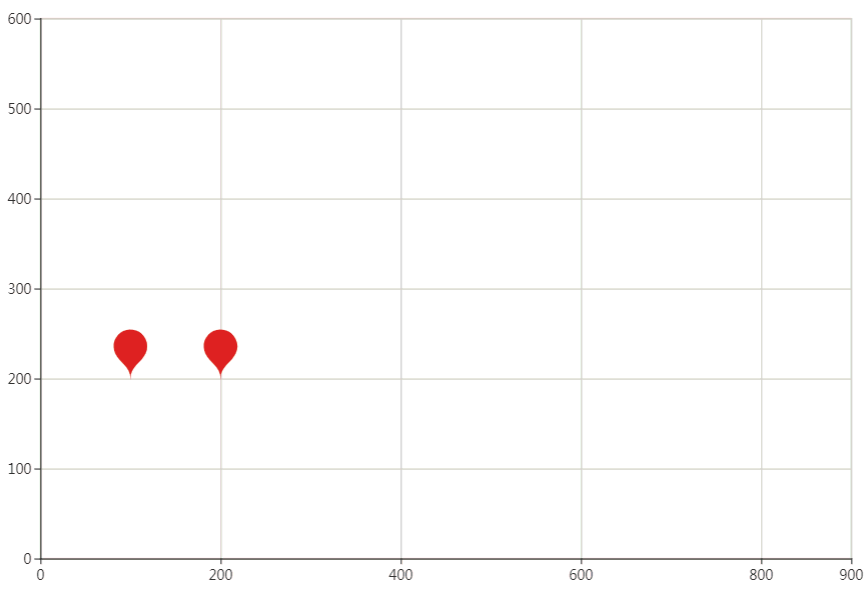
//注释掉coordinateSystem: 'cartesian2d', data 和 edges可以显示 (但是坐标不对应)
This is an automated message from the Apache Git Service.
To respond to the message, please log on GitHub and use the
URL above to go to the specific comment.
For queries about this service, please contact Infrastructure at:
us...@infra.apache.org
With regards,
Apache Git Services
-
To unsubscribe, e-mail: dev-unsubscr...@echarts.apache.org
For additional commands, e-mail: dev-h...@echarts.apache.org
[GitHub] Amine-H opened a new issue #8239: Webpack tree shaking not working too well on echarts
Amine-H opened a new issue #8239: Webpack tree shaking not working too well on
echarts
URL: https://github.com/apache/incubator-echarts/issues/8239
### One-line summary [问题简述]
Webpack tree shaking not working too well on echarts

### Version & Environment [版本及环境]
+ ECharts version [ECharts 版本]: 4.0.4
+ Browser version [浏览器类型和版本]: Chrome 65.0.3325.181 (Official Build) (64 bits)
+ OS Version [操作系统类型和版本]: macOS 10.13.4
### Expected behaviour [期望结果]
would be great if I could only bundle Piechart into my solution.
### ECharts option [ECharts配置项]
```javascript
option = {
}
```
### Other comments [其他信息]
This is an automated message from the Apache Git Service.
To respond to the message, please log on GitHub and use the
URL above to go to the specific comment.
For queries about this service, please contact Infrastructure at:
us...@infra.apache.org
With regards,
Apache Git Services
-
To unsubscribe, e-mail: dev-unsubscr...@echarts.apache.org
For additional commands, e-mail: dev-h...@echarts.apache.org
[GitHub] lijianhu1 opened a new issue #8238: echarts4.0折线图在小程序中好像不兼容安卓和IOS样式(拐点样式)
lijianhu1 opened a new issue #8238: echarts4.0折线图在小程序中好像不兼容安卓和IOS样式(拐点样式)
URL: https://github.com/apache/incubator-echarts/issues/8238


   echarts4.0版本折线图在小程序中好像不兼容安卓和IOS样式(拐点样式)


   ### One-line summary [问题简述]

我司小程序项目中的拐点样式是白底红框的圆形,我再安卓上已经实现了该效果,但是在IOS上除了第一个拐点是正常,其他拐点都是黑色的,尝试过各种办法仍无法解决问题。且当我把xAxis.boundaryGap设为false时,最后一个拐点未渲染出来。


   ### Version & Environment [版本及环境]
   + ECharts version [ECharts 版本]: 4.0.4
   + Browser version [浏览器类型和版本]: 小程序
   + OS Version [操作系统类型和版本]:  IOS


   ### Expected behaviour [期望结果]
   若在下操作问题还望指点,如是echart兼容性问题,也希望能早日解决。谢谢!


   ### ECharts option [ECharts配置项]


   ```javascript
   option = {
   backgroundColor: "#f3f4f8",
   color: ["#fd5064"],
   tooltip: {
 trigger: 'none'
   },
   legend: {
 // data: ['A商品']
   },
   grid: {
 containLabel: true,
 left:10,
 right:20,
 bottom:20,
 top:20,
   },

   xAxis: {
 type: 'category',
 boundaryGap: true,
 data: _date,
 minInterval:1,
 splitLine:{
   show:true,
   lineStyle:{
 color:'#fff'
   }
 },
 axisTick:{
   show:false,

 },
 axisLine:{
   show:false
 },
 axisLabel:{
   show:true,
   interval:0,
 },
 interval:1,
   },
   yAxis: {
 x: 'center',
 type: 'value',
 min:0,
 minInterval:1,
 splitLine:{
   show:true,
   lineStyle:{
 color:'#fff'
   }
 },
 axisLine:{
   show:false
 },
 axisTick:{
   show:false
 },
 axisLabel : {
   formatter: function(){
 return "";
   }
 }
   },
   series: [{
 // name: '过去7日零钱收益',
 type: 'line',
 smooth: false,  //平滑度
 data: _value,
 symbolSize: 8,//拐点大小
 symbol:'circle',//拐点样式
 areaStyle: {
   color:'#f9eaed',
   shadowColor:'#f9eaed'
 },
 itemStyle : {
   normal: {
 label : {show: true,formatter:'+{c}',color:'#ff4f66'},
 color:'#fff',
 borderColor:'#ff4f66',
 borderWidth:2,
 shadowColor:'#fff',
 shadowBlur:0,
 lineStyle:{
   width:2,//折线宽度
   color:"#ff4f66"//折线颜色
 }
 },

 },

   }]
   }

   ```


   ### Other comments [其他信息]


This is an automated message from the Apache Git Service.
To respond to the message, please log on GitHub and use the
URL above to go to the specific comment.

For queries about this service, please contact Infrastructure at:
us...@infra.apache.org


With regards,
Apache Git Services

-
To unsubscribe, e-mail: dev-unsubscr...@echarts.apache.org
For additional commands, e-mail: dev-h...@echarts.apache.org
[GitHub] orca-zhang opened a new issue #8237: [WIP] series无法设置name为set、get
orca-zhang opened a new issue #8237: [WIP] series无法设置name为set、get
URL: https://github.com/apache/incubator-echarts/issues/8237


   ### One-line summary [问题简述]
   series设置name为set、get后,无法正常显示
   测试时使用折线图
   控制台抛错信息为set、get不为function,猜测属性覆盖了方法


   ### Version & Environment [版本及环境]
   + ECharts version [ECharts 版本]:2.0
   + Browser version [浏览器类型和版本]:Chrome 63.0
   + OS Version [操作系统类型和版本]:Windows 10 (1709)


   ### Expected behaviour [期望结果]
   能够正常显示


   ### ECharts option [ECharts配置项]


   ```javascript
   option = {
   title: {
   text: 'linked_hash_set'
   },
   tooltip: {
   trigger: 'axis'
   },
   legend: {
   data:['get','set']
   },
   grid: {
   left: '3%',
   right: '4%',
   bottom: '3%',
   containLabel: true
   },
   toolbox: {
   feature: {
   saveAsImage: {}
   }
   },
   xAxis: {
   type: 'category',
   data: ['insert','count','find','erase','pop_front','clear']
   },
   yAxis: {
   type: 'value'
   },
   series: [
   {
   name:'get',
   type:'line',
   data:[2.50, 1.61, 1.75, 0.05, 0.00, 0.00]
   },
   {
   name:'set',
   type:'line',
   data:[0.16, 0.29, 0.15, 0.11, 0.00, 0.00]
   }
   ]
   };

   ```


   ### Other comments [其他信息]


This is an automated message from the Apache Git Service.
To respond to the message, please log on GitHub and use the
URL above to go to the specific comment.

For queries about this service, please contact Infrastructure at:
us...@infra.apache.org


With regards,
Apache Git Services

-
To unsubscribe, e-mail: dev-unsubscr...@echarts.apache.org
For additional commands, e-mail: dev-h...@echarts.apache.org
[GitHub] zgr126 commented on issue #7989: 直角坐标系下Line/Bar的stack在某些情况下设置无效
zgr126 commented on issue #7989:  直角坐标系下Line/Bar的stack在某些情况下设置无效
URL:
https://github.com/apache/incubator-echarts/issues/7989#issuecomment-384922175


   我就感觉时间类型不能堆叠,郁闷一天了


This is an automated message from the Apache Git Service.
To respond to the message, please log on GitHub and use the
URL above to go to the specific comment.

For queries about this service, please contact Infrastructure at:
us...@infra.apache.org


With regards,
Apache Git Services

-
To unsubscribe, e-mail: dev-unsubscr...@echarts.apache.org
For additional commands, e-mail: dev-h...@echarts.apache.org
[GitHub] dantelife commented on issue #3354: Echarts3雷达图tooltip只需显示当前点的value值
dantelife commented on issue #3354: Echarts3雷达图tooltip只需显示当前点的value值
URL:
https://github.com/apache/incubator-echarts/issues/3354#issuecomment-384904147


   @mmmaomao21 不应该,好好看下你option。具体什么情况?贴图看看。


This is an automated message from the Apache Git Service.
To respond to the message, please log on GitHub and use the
URL above to go to the specific comment.

For queries about this service, please contact Infrastructure at:
us...@infra.apache.org


With regards,
Apache Git Services

-
To unsubscribe, e-mail: dev-unsubscr...@echarts.apache.org
For additional commands, e-mail: dev-h...@echarts.apache.org
[GitHub] mmmaomao21 commented on issue #3354: Echarts3雷达图tooltip只需显示当前点的value值
mmmaomao21 commented on issue #3354: Echarts3雷达图tooltip只需显示当前点的value值
URL:
https://github.com/apache/incubator-echarts/issues/3354#issuecomment-384898803


   @dantelife   用了你上面那个 发现雷达图周围一圈文字没有了
   就是设置indicator的那个


This is an automated message from the Apache Git Service.
To respond to the message, please log on GitHub and use the
URL above to go to the specific comment.

For queries about this service, please contact Infrastructure at:
us...@infra.apache.org


With regards,
Apache Git Services

-
To unsubscribe, e-mail: dev-unsubscr...@echarts.apache.org
For additional commands, e-mail: dev-h...@echarts.apache.org
[GitHub] penxu opened a new issue #8236: SVG渲染文字大小无效
penxu opened a new issue #8236: SVG渲染文字大小无效
URL: https://github.com/apache/incubator-echarts/issues/8236
### One-line summary [问题简述]
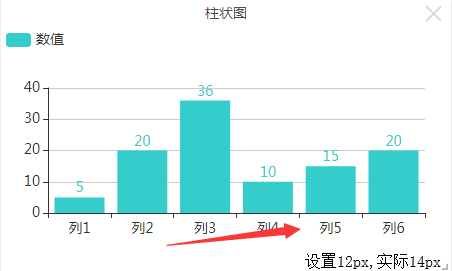
设置横坐标字体为12px,实际渲染我14px,不管设置多大都没有效果
### Version & Environment [版本及环境]
+ ECharts version [ECharts 版本]:
+ Browser version [浏览器类型和版本]:
+ OS Version [操作系统类型和版本]:
4.0.4
windows
### Expected behaviour [期望结果]
### ECharts option [ECharts配置项]
```javascript
option = {
'tooltip': {
'trigger': 'axis',
'axisPointer': {
'type': 'shadow'
}
},
'legend': {
'left': 'left'
},
'xAxis': [
{
'type': 'category',
'data': ['列1', '列2', '列3', '列4', '列5', '列6'],
'axisLabel': {
'fontSize': 12
}
}
],
'yAxis': {},
'series': [
{
'data': [5, 20, 36, 10, 15, 20],
'name': '数值',
'type': 'bar',
'label': {
'show': true,
'position': 'top'
},
'barMaxWidth': 50,
'barMinHeight': 5
}
]
}
```
### Other comments [其他信息]
This is an automated message from the Apache Git Service.
To respond to the message, please log on GitHub and use the
URL above to go to the specific comment.
For queries about this service, please contact Infrastructure at:
us...@infra.apache.org
With regards,
Apache Git Services
-
To unsubscribe, e-mail: dev-unsubscr...@echarts.apache.org
For additional commands, e-mail: dev-h...@echarts.apache.org
[GitHub] surjikal commented on issue #4082: Pie (and other) charts with label going outside of canvas
surjikal commented on issue #4082: Pie (and other) charts with label going
outside of canvas
URL:
https://github.com/apache/incubator-echarts/issues/4082#issuecomment-384881219


   This is still an issue.


This is an automated message from the Apache Git Service.
To respond to the message, please log on GitHub and use the
URL above to go to the specific comment.

For queries about this service, please contact Infrastructure at:
us...@infra.apache.org


With regards,
Apache Git Services

-
To unsubscribe, e-mail: dev-unsubscr...@echarts.apache.org
For additional commands, e-mail: dev-h...@echarts.apache.org
[GitHub] surjikal commented on issue #4082: Pie (and other) charts with label going outside of canvas
surjikal commented on issue #4082: Pie (and other) charts with label going
outside of canvas
URL:
https://github.com/apache/incubator-echarts/issues/4082#issuecomment-384881219


   This is still a problem.


This is an automated message from the Apache Git Service.
To respond to the message, please log on GitHub and use the
URL above to go to the specific comment.

For queries about this service, please contact Infrastructure at:
us...@infra.apache.org


With regards,
Apache Git Services

-
To unsubscribe, e-mail: dev-unsubscr...@echarts.apache.org
For additional commands, e-mail: dev-h...@echarts.apache.org
[GitHub] MerlChen opened a new issue #8235: 【折线图堆叠BUG】
MerlChen opened a new issue #8235: 【折线图堆叠BUG】
URL: https://github.com/apache/incubator-echarts/issues/8235
### One-line summary [问题简述]
```
1、某一折线图的某个点数值为0时,它的点不会掉到最下面,而是取下一条线的对应的点
```

### Version & Environment [版本及环境]
+ ECharts version [ECharts 版本]:
+ Browser version [浏览器类型和版本]:
+ OS Version [操作系统类型和版本]:
### Expected behaviour [期望结果]
正常显示,为0时,掉到最底部
### ECharts option [ECharts配置项]
```javascript
option = {
title: {
text: '折线图堆叠'
},
tooltip: {
trigger: 'axis'
},
legend: {
data:['邮件营销','联盟广告','视频广告','直接访问','搜索引擎']
},
grid: {
left: '3%',
right: '4%',
bottom: '3%',
containLabel: true
},
toolbox: {
feature: {
saveAsImage: {}
}
},
xAxis: {
type: 'category',
boundaryGap: false,
data: ['周一','周二','周三','周四','周五','周六','周日']
},
yAxis: {
type: 'value'
},
series: [
{
name:'邮件营销',
type:'line',
stack: '总量',
data:[12, 132, 101, 134, 90, 230, 210]
},
{
name:'联盟广告',
type:'line',
stack: '总量',
data:[220, 182, 191, 234, 290, 330, 310]
},
{
name:'视频广告',
type:'line',
stack: '总量',
data:[1, 232, 201, 154, 190, 330, 410]
},
{
name:'直接访问',
type:'line',
stack: '总量',
data:[320, 332, 301, 334, 390, 330, 320]
},
{
name:'搜索引擎',
type:'line',
stack: '总量',
data:[0, 0, 0, 0, 1290, 1330, 1320]
}
]
};
```
### Other comments [其他信息]

联系方式:QQ 379181273
This is an automated message from the Apache Git Service.
To respond to the message, please log on GitHub and use the
URL above to go to the specific comment.
For queries about this service, please contact Infrastructure at:
us...@infra.apache.org
With regards,
Apache Git Services
-
To unsubscribe, e-mail: dev-unsubscr...@echarts.apache.org
For additional commands, e-mail: dev-h...@echarts.apache.org