[GitHub] maicss closed issue #8300: [功能][折线]能不能在一条折线的指定范围内显示成虚线?
maicss closed issue #8300: [功能][折线]能不能在一条折线的指定范围内显示成虚线?
URL: https://github.com/apache/incubator-echarts/issues/8300


This is an automated message from the Apache Git Service.
To respond to the message, please log on GitHub and use the
URL above to go to the specific comment.

For queries about this service, please contact Infrastructure at:
us...@infra.apache.org


With regards,
Apache Git Services

-
To unsubscribe, e-mail: dev-unsubscr...@echarts.apache.org
For additional commands, e-mail: dev-h...@echarts.apache.org
[GitHub] kelvinau commented on issue #7029: Ribbon Chord Diagram like echarts2
kelvinau commented on issue #7029: Ribbon Chord Diagram like echarts2
URL:
https://github.com/apache/incubator-echarts/issues/7029#issuecomment-388120365


   It's been about half a year. Is this still being considered to implement? I
am trying to use echarts 2 for this chart type but it's quite hard to use, even
just for changing the color of the ribbon and node.


This is an automated message from the Apache Git Service.
To respond to the message, please log on GitHub and use the
URL above to go to the specific comment.

For queries about this service, please contact Infrastructure at:
us...@infra.apache.org


With regards,
Apache Git Services

-
To unsubscribe, e-mail: dev-unsubscr...@echarts.apache.org
For additional commands, e-mail: dev-h...@echarts.apache.org
[GitHub] kelvinau commented on issue #7029: Ribbon Chord Diagram like echarts2
kelvinau commented on issue #7029: Ribbon Chord Diagram like echarts2
URL:
https://github.com/apache/incubator-echarts/issues/7029#issuecomment-388120365


   It's been about half a year. Is this still being considered to implement? I
am trying to use echarts 2 for this chart type but it's quite hard to use, even
for just changing the color of an item.


This is an automated message from the Apache Git Service.
To respond to the message, please log on GitHub and use the
URL above to go to the specific comment.

For queries about this service, please contact Infrastructure at:
us...@infra.apache.org


With regards,
Apache Git Services

-
To unsubscribe, e-mail: dev-unsubscr...@echarts.apache.org
For additional commands, e-mail: dev-h...@echarts.apache.org
[GitHub] kelvinau commented on issue #7029: Ribbon Chord Diagram like echarts2
kelvinau commented on issue #7029: Ribbon Chord Diagram like echarts2
URL:
https://github.com/apache/incubator-echarts/issues/7029#issuecomment-388120365


   It's been about half a year. Is this planning to be implemented? I am trying
to use echarts 2 for this chart type but it's quite hard to use, even for just
changing the color of an item.


This is an automated message from the Apache Git Service.
To respond to the message, please log on GitHub and use the
URL above to go to the specific comment.

For queries about this service, please contact Infrastructure at:
us...@infra.apache.org


With regards,
Apache Git Services

-
To unsubscribe, e-mail: dev-unsubscr...@echarts.apache.org
For additional commands, e-mail: dev-h...@echarts.apache.org
[GitHub] nickelmatt opened a new issue #8320: Tooltip isn't visible when canvas is passed instead of div during init
nickelmatt opened a new issue #8320: Tooltip isn't visible when canvas is
passed instead of div during init
URL: https://github.com/apache/incubator-echarts/issues/8320


   When "echarts.init" is called and given a canvas as the parameter instead of
a div, the tooltip div is appended as a child of the canvas. This make it not
work.


   ### Version & Environment [版本及环境]
   + ECharts version [ECharts 4.1.0.rc2 Full]:
   + Browser version [Google Chrome Version 66.0.3359.139 (Official Build)
(64-bit)]:
   + OS Version [Ubuntu 16.04 LTS]:


   ### Expected behaviour [期望结果]
   When a canvas is passed, the parent element would most probably be a div.
The tooltip should be appended to the parent element instead. I've included a
patch that removes the tooltip from the canvas and append it to the parent
element and it works.


   ### ECharts option [ECharts配置项]
   ```javascript
options = {
   tooltip: {
   trigger: 'axis',
   position: function(point, params, dom, rect, size) {
   dom.parentElement.removeChild(dom);
   document.getElementById("chart").appendChild(dom);
   }
   },
   }

   ```


This is an automated message from the Apache Git Service.
To respond to the message, please log on GitHub and use the
URL above to go to the specific comment.

For queries about this service, please contact Infrastructure at:
us...@infra.apache.org


With regards,
Apache Git Services

-
To unsubscribe, e-mail: dev-unsubscr...@echarts.apache.org
For additional commands, e-mail: dev-h...@echarts.apache.org
[GitHub] waitkafuka opened a new issue #8319: 3D绘制surface曲面中的问题
waitkafuka opened a new issue #8319: 3D绘制surface曲面中的问题
URL: https://github.com/apache/incubator-echarts/issues/8319
3D surface图表中的数据坐标,有什么要求吗?按理说不是应该空间中任意三个不重合的点都可以绘制出一个面吗?为什么在实际中绘制不了呢?
代码:
`var myChart =
echarts.init(document.getElementsByClassName('chart-container')[0]);
var data = [
[-1, -1, 0],
[0, -1, 0],
[0.5, -1, 0],
];
var option = {
grid3D: {
},
xAxis3D: {
},
yAxis3D: {
},
zAxis3D: {
},
series: [{
type: 'surface',
data:data
}]
}
myChart.setOption(option);`
实际上是想做一个类似这样的图:

但是用上面的代码,把数据放进去,渲染不出来,是一片空白:
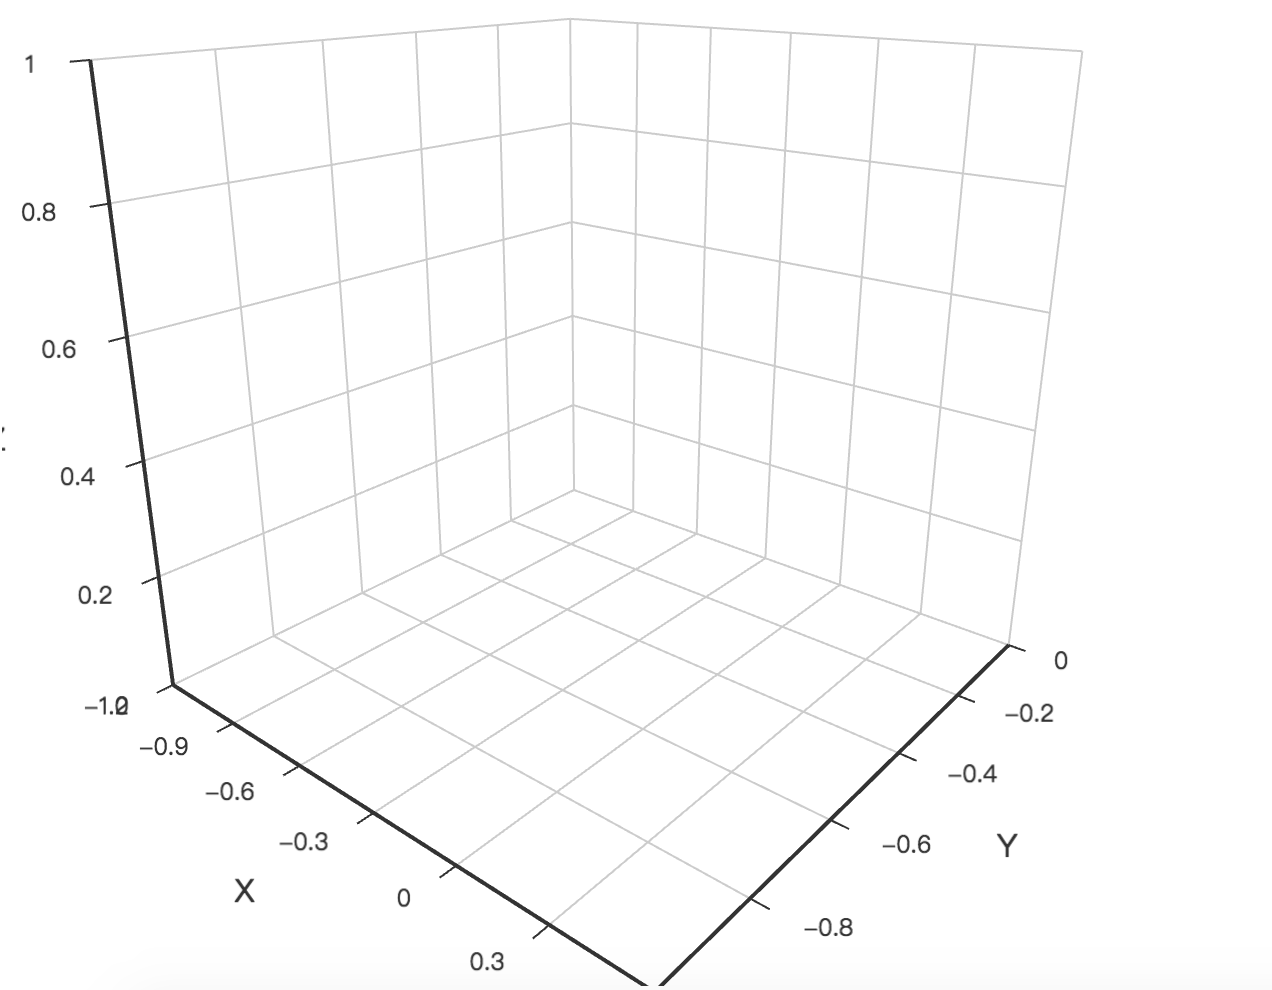
求解!
是对data有什么要求?
This is an automated message from the Apache Git Service.
To respond to the message, please log on GitHub and use the
URL above to go to the specific comment.
For queries about this service, please contact Infrastructure at:
us...@infra.apache.org
With regards,
Apache Git Services
-
To unsubscribe, e-mail: dev-unsubscr...@echarts.apache.org
For additional commands, e-mail: dev-h...@echarts.apache.org
[GitHub] YzPaul3 commented on issue #6811: 关系图graph支持两个data节点之间多条link,每个link代表一种关系,并可以筛选?
YzPaul3 commented on issue #6811: 关系图graph支持两个data节点之间多条link,每个link代表一种关系,并可以筛选?
URL:
https://github.com/apache/incubator-echarts/issues/6811#issuecomment-388041395


   是目前还不支持吧?


This is an automated message from the Apache Git Service.
To respond to the message, please log on GitHub and use the
URL above to go to the specific comment.

For queries about this service, please contact Infrastructure at:
us...@infra.apache.org


With regards,
Apache Git Services

-
To unsubscribe, e-mail: dev-unsubscr...@echarts.apache.org
For additional commands, e-mail: dev-h...@echarts.apache.org
[GitHub] YzPaul3 commented on issue #8317: 能否让力导图节点之间有多条连线
YzPaul3 commented on issue #8317: 能否让力导图节点之间有多条连线
URL:
https://github.com/apache/incubator-echarts/issues/8317#issuecomment-388041180


   同样建议,可以展示出两个节点之间的不同关系。目前只能转投向d3来实现


This is an automated message from the Apache Git Service.
To respond to the message, please log on GitHub and use the
URL above to go to the specific comment.

For queries about this service, please contact Infrastructure at:
us...@infra.apache.org


With regards,
Apache Git Services

-
To unsubscribe, e-mail: dev-unsubscr...@echarts.apache.org
For additional commands, e-mail: dev-h...@echarts.apache.org
[GitHub] jeffmobiles commented on issue #8316: Uncaught Error: series.type should be specified.
jeffmobiles commented on issue #8316: Uncaught Error: series.type should be
specified.
URL:
https://github.com/apache/incubator-echarts/issues/8316#issuecomment-388039024


   你这个问题完全是伸手党,不自己排查问题。
   这个不是Issue啊,
   你的series的type属性没有设置。 提示的问题也告诉了,series的type要指定。
   var item = {
type: 'line' || 'bar' .
 ...
   }


This is an automated message from the Apache Git Service.
To respond to the message, please log on GitHub and use the
URL above to go to the specific comment.

For queries about this service, please contact Infrastructure at:
us...@infra.apache.org


With regards,
Apache Git Services

-
To unsubscribe, e-mail: dev-unsubscr...@echarts.apache.org
For additional commands, e-mail: dev-h...@echarts.apache.org
[GitHub] baoqger opened a new issue #8318: multiple tree共用一个root?
baoqger opened a new issue #8318: multiple tree共用一个root?
URL: https://github.com/apache/incubator-echarts/issues/8318


   现在只支持left to right,
或者right-to-left的tree形图,如果left和right都需要的话,如何处理呢?想用multiple
tree来模拟,但是又不能共用一个root,无法实现。


This is an automated message from the Apache Git Service.
To respond to the message, please log on GitHub and use the
URL above to go to the specific comment.

For queries about this service, please contact Infrastructure at:
us...@infra.apache.org


With regards,
Apache Git Services

-
To unsubscribe, e-mail: dev-unsubscr...@echarts.apache.org
For additional commands, e-mail: dev-h...@echarts.apache.org
[GitHub] yanggaojun101 opened a new issue #8317: 能否让力导图节点之间有多条连线
yanggaojun101 opened a new issue #8317: 能否让力导图节点之间有多条连线 URL: https://github.com/apache/incubator-echarts/issues/8317 目前两个节点无法有两条同向的线条 希望能像如图所示那样,两个节点之间可以有多条连线 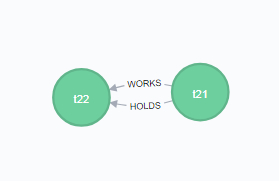 This is an automated message from the Apache Git Service. To respond to the message, please log on GitHub and use the URL above to go to the specific comment. For queries about this service, please contact Infrastructure at: us...@infra.apache.org With regards, Apache Git Services - To unsubscribe, e-mail: dev-unsubscr...@echarts.apache.org For additional commands, e-mail: dev-h...@echarts.apache.org
[GitHub] ashen9 commented on issue #8281: 4.1.0 渲染方式改成svg,结果绘制的时候还是canvas
ashen9 commented on issue #8281: 4.1.0 渲染方式改成svg,结果绘制的时候还是canvas
URL:
https://github.com/apache/incubator-echarts/issues/8281#issuecomment-387966513


   引入了  import 'zrender/lib/svg/svg';
   发现问题了,使用 import 'zrender/src/svg/svg';可以,但是柱形图报错如下:
Cannot read property '0' of null
   at Object.rotate [as f] (matrix.js?8403:98)


This is an automated message from the Apache Git Service.
To respond to the message, please log on GitHub and use the
URL above to go to the specific comment.

For queries about this service, please contact Infrastructure at:
us...@infra.apache.org


With regards,
Apache Git Services

-
To unsubscribe, e-mail: dev-unsubscr...@echarts.apache.org
For additional commands, e-mail: dev-h...@echarts.apache.org
[GitHub] ashen9 commented on issue #8281: 4.1.0 渲染方式改成svg,结果绘制的时候还是canvas
ashen9 commented on issue #8281: 4.1.0 渲染方式改成svg,结果绘制的时候还是canvas
URL:
https://github.com/apache/incubator-echarts/issues/8281#issuecomment-387966513


   引入了  import 'zrender/lib/svg/svg';


This is an automated message from the Apache Git Service.
To respond to the message, please log on GitHub and use the
URL above to go to the specific comment.

For queries about this service, please contact Infrastructure at:
us...@infra.apache.org


With regards,
Apache Git Services

-
To unsubscribe, e-mail: dev-unsubscr...@echarts.apache.org
For additional commands, e-mail: dev-h...@echarts.apache.org