[GitHub] ZHUYUANWEI commented on issue #6911: echarts3没有网站热力图,还没有2好用,是在倒退么?
ZHUYUANWEI commented on issue #6911: echarts3没有网站热力图,还没有2好用,是在倒退么?
URL:
https://github.com/apache/incubator-echarts/issues/6911#issuecomment-389379530


   实在太可惜了,我现在也想用这种热力图,不想再引一个组件了


This is an automated message from the Apache Git Service.
To respond to the message, please log on GitHub and use the
URL above to go to the specific comment.

For queries about this service, please contact Infrastructure at:
us...@infra.apache.org


With regards,
Apache Git Services

-
To unsubscribe, e-mail: dev-unsubscr...@echarts.apache.org
For additional commands, e-mail: dev-h...@echarts.apache.org
[GitHub] cnyb-kwange commented on issue #6239: 如何获取dataZoom缩放的位置
cnyb-kwange commented on issue #6239: 如何获取dataZoom缩放的位置 URL: https://github.com/apache/incubator-echarts/issues/6239#issuecomment-389372074 myChart.getOption().dataZoom 返回的值 startValue , endValue 与 x轴值 不是一样的值  比图中显示的2860.15625 , 6764.0625 都大。 这是怎么回事呢? This is an automated message from the Apache Git Service. To respond to the message, please log on GitHub and use the URL above to go to the specific comment. For queries about this service, please contact Infrastructure at: us...@infra.apache.org With regards, Apache Git Services - To unsubscribe, e-mail: dev-unsubscr...@echarts.apache.org For additional commands, e-mail: dev-h...@echarts.apache.org
[GitHub] myq0116 opened a new issue #8348: 微信小程序中使用echarts配置引用之后没有报错但是也没有显示出来
myq0116 opened a new issue #8348: 微信小程序中使用echarts配置引用之后没有报错但是也没有显示出来
URL: https://github.com/apache/incubator-echarts/issues/8348
微信小程序中使用echarts配置引用之后没有报错但是也没有显示出来
### One-line summary [问题简述]
微信小程序中使用echarts配置引用之后没有报错但是也没有显示出来
### Version & Environment [版本及环境]微信小程序v1.9.98
+ ECharts version [ECharts 版本]:
+ Browser version [浏览器类型和版本]:
+ OS Version [操作系统类型和版本]:
### Expected behaviour [期望结果]
### ECharts option [ECharts配置项]
```javascript
import * as echarts from '../../ec-canvas/echarts';
function initChart(canvas, width, height) {
const chart = echarts.init(canvas, null, {
width: width,
height: height
});
canvas.setChart(chart);
var option = {
title: {
text: '某站点用户访问来源',
subtext: '纯属虚构',
x: 'center'
},
tooltip: {
trigger: 'item',
formatter: "{a} {b} : {c} ({d}%)"
},
legend: {
orient: 'vertical',
left: 'left',
data: ['直接访问', '邮件营销', '联盟广告', '视频广告', '搜索引擎']
},
series: [
{
name: '访问来源',
type: 'pie',
radius: '55%',
center: ['50%', '60%'],
data: [
{ value: 335, name: '直接访问' },
{ value: 310, name: '邮件营销' },
{ value: 234, name: '联盟广告' },
{ value: 135, name: '视频广告' },
{ value: 1548, name: '搜索引擎' }
],
itemStyle: {
emphasis: {
shadowBlur: 10,
shadowOffsetX: 0,
shadowColor: 'rgba(0, 0, 0, 0.5)'
}
}
}
]
};
chart.setOption(option);
return chart;
}
Page({
data: {
ec: {
onInit: initChart
}
}
});
```
### Other comments [其他信息]


This is an automated message from the Apache Git Service.
To respond to the message, please log on GitHub and use the
URL above to go to the specific comment.
For queries about this service, please contact Infrastructure at:
us...@infra.apache.org
With regards,
Apache Git Services
-
To unsubscribe, e-mail: dev-unsubscr...@echarts.apache.org
For additional commands, e-mail: dev-h...@echarts.apache.org
[GitHub] 349989153 commented on issue #5548: 请问如何去掉没有数据的 bar,现在占了位置。
349989153 commented on issue #5548: 请问如何去掉没有数据的 bar,现在占了位置。
URL:
https://github.com/apache/incubator-echarts/issues/5548#issuecomment-389365468


   @pissang 没有太看懂啊,什么叫只要去掉一年级的就可以了,一年级的有数据的啊


This is an automated message from the Apache Git Service.
To respond to the message, please log on GitHub and use the
URL above to go to the specific comment.

For queries about this service, please contact Infrastructure at:
us...@infra.apache.org


With regards,
Apache Git Services

-
To unsubscribe, e-mail: dev-unsubscr...@echarts.apache.org
For additional commands, e-mail: dev-h...@echarts.apache.org
[GitHub] pchaganti opened a new issue #8347: Any way to convert a bar to a pie using magicType?
pchaganti opened a new issue #8347: Any way to convert a bar to a pie using
magicType?
URL: https://github.com/apache/incubator-echarts/issues/8347


   ### One-line summary [问题简述]
   Looking for a way to convert a bar chart to a pie using the
toolbox/magicType? Anyone have any pointers to how to do this?

   thanks


   ### Version & Environment [版本及环境]
   + ECharts version [ECharts 版本]:
   + Browser version [浏览器类型和版本]:
   + OS Version [操作系统类型和版本]:


   ### Expected behaviour [期望结果]


   ### ECharts option [ECharts配置项]


   ```javascript
   option = {

   }

   ```


   ### Other comments [其他信息]


This is an automated message from the Apache Git Service.
To respond to the message, please log on GitHub and use the
URL above to go to the specific comment.

For queries about this service, please contact Infrastructure at:
us...@infra.apache.org


With regards,
Apache Git Services

-
To unsubscribe, e-mail: dev-unsubscr...@echarts.apache.org
For additional commands, e-mail: dev-h...@echarts.apache.org
[GitHub] pchaganti commented on issue #4639: Downsample data in long timeseries chart
pchaganti commented on issue #4639: Downsample data in long timeseries chart URL: https://github.com/apache/incubator-echarts/issues/4639#issuecomment-389289741 This is an automated message from the Apache Git Service. To respond to the message, please log on GitHub and use the URL above to go to the specific comment. For queries about this service, please contact Infrastructure at: us...@infra.apache.org With regards, Apache Git Services - To unsubscribe, e-mail: dev-unsubscr...@echarts.apache.org For additional commands, e-mail: dev-h...@echarts.apache.org
[GitHub] amittonge opened a new issue #8346: Graph chart links.lineStyle.symbol and links.lineStyle.symbolSize is not working
amittonge opened a new issue #8346: Graph chart links.lineStyle.symbol and
links.lineStyle.symbolSize is not working
URL: https://github.com/apache/incubator-echarts/issues/8346


   ### One-line summary [问题简述]


   ### Version & Environment [版本及环境]
   + ECharts version [ECharts 版本]:
   + Browser version [浏览器类型和版本]:
   + OS Version [操作系统类型和版本]:


   ### Expected behaviour [期望结果]


   ### ECharts option [ECharts配置项]


   ```javascript
   option = {

   }

   ```


   ### Other comments [其他信息]


This is an automated message from the Apache Git Service.
To respond to the message, please log on GitHub and use the
URL above to go to the specific comment.

For queries about this service, please contact Infrastructure at:
us...@infra.apache.org


With regards,
Apache Git Services

-
To unsubscribe, e-mail: dev-unsubscr...@echarts.apache.org
For additional commands, e-mail: dev-h...@echarts.apache.org
[GitHub] hAtul89 opened a new issue #8345: How do I change the loaders text every x seconds without "bothering" the loader animation?
hAtul89 opened a new issue #8345: How do I change the loaders text every x
seconds without "bothering" the loader animation?
URL: https://github.com/apache/incubator-echarts/issues/8345


   This is part of my object:


const qwData = {

// Initialize functions
init: function() {
this.cacheDom();
this.bindEvents();
},
// Cache vars
cacheDom: function() {
this.dataDisplayed  = false;
this.countUsers = ;
this.$form  =
$('#frm_reportit');
this.start_date =
this.$form[0][9].value;
this.end_date   =
this.$form[0][10].value;
this.dateCount  =
this.countDays(this.start_date, this.end_date);
this.show   =
document.querySelector('#btn-show');
this.downloadBtn=
document.querySelector('#download_summary_button');
this.$dataContainer = $('#qw-data-container');
this.$qwTable   = $('#qwtable');
this.$qwTbody   =
this.$qwTable.find('tbody');
this.qwChart=
echarts.init(document.getElementById('main-chart'));
this.progressBar=
document.querySelector('.progress-bar');
Object.defineProperty(this, "progress", {
get: () => {
   return this.progressPrecent || 0;
},
set: (value) => {

if(value != this.progressPrecent){
  this.progressPrecent = value;
  this.setQwChartProgress(value);
  this.setProgressBarValue(value);
}
},
  configurable: true
});
this.qwChartProgress = this.progress;
},
// Bind click events (or any events..)
bindEvents: function() {

var that = this;

// On click "Show" BTN
this.show.onclick = this.sendData.bind(this);

// On Change inputs
this.$form.change(function(){
that.updateDatesInputs(this);
});

},
setQwChartProgress: function(value){
if (value != 0) {
// Show Chart Loading
this.qwChart.showLoading({
color: '#00b0f0',
text: value + '%'
});
}
},sendData: function(e) {
e.preventDefault();
let that = this;

$.ajax({
type: 'POST',
url: "/test/ajax.php?module=test_module",
dataType: 'json',
data: {
start_ts: that.start_date,
stop_ts: that.end_date,
submitted: true
},
beforeSend: function() {

// Show Chart Loading
that.qwChart.showLoading({
color: '#00b0f0',
// text:
that.returnNumWithPrecent(that.progress)
text: that.qwChartProgress
});

// If data div isn't displayed
if (!that.dataDisplayed) {
// Show divs loading
that.showMainDiv();
} else {
that.$qwTbody.slideUp('fast');
that.$qwTbody.html('');
}
},
complete: function(){


let timer = setInterval(that.incrementProgress, 500);

},
success: function(result){

// Set progressbar to 100%
that.setProgressBarTo100();

// Show Download Button
that.downloadBtn.style.display = 'inline-block';
[GitHub] luowengang commented on issue #7293: y轴类型为log时,启用visualMap出现异常
luowengang commented on issue #7293: y轴类型为log时,启用visualMap出现异常
URL:
https://github.com/apache/incubator-echarts/issues/7293#issuecomment-389140458


   请问谁清楚, 该问题是否已经在新版本中解决?


This is an automated message from the Apache Git Service.
To respond to the message, please log on GitHub and use the
URL above to go to the specific comment.

For queries about this service, please contact Infrastructure at:
us...@infra.apache.org


With regards,
Apache Git Services

-
To unsubscribe, e-mail: dev-unsubscr...@echarts.apache.org
For additional commands, e-mail: dev-h...@echarts.apache.org
[GitHub] kingecg opened a new issue #8344: timeseries动态更新数据时图像抖动
kingecg opened a new issue #8344: timeseries动态更新数据时图像抖动
URL: https://github.com/apache/incubator-echarts/issues/8344


   ### One-line summary [问题简述]
   当采用setInterval动态更新数据时,如果使用dataset或series.data是一个二维数组,图像会产生很明显的抖动。


   ### Version & Environment [版本及环境]
   + ECharts version [ECharts 版本]: 4.1.0
   + Browser version [浏览器类型和版本]: chrome  66.0.3359.139
   + OS Version [操作系统类型和版本]: Mac osx most recent version


   ### Expected behaviour [期望结果]
   如官方示例,timeseries曲线更新能够没有抖动
   http://echarts.baidu.com/examples/editor.html?c=dynamic-data2


   ### ECharts option [ECharts配置项]


   ```javascript
   function randomData() {
   now = new Date(+now + oneDay);
   value = value + Math.random() * 21 - 10;
   return  [
   now,
   Math.round(value)
   ]

   }

   var data = [];
   var now = +new Date(1997, 9, 3);
   var oneDay =  1000;
   var value = Math.random() * 1000;
   for (var i = 0; i < 1000; i++) {
   data.push(randomData());
   }

   option = {
   title: {
   text: '动态数据 + 时间坐标轴'
   },
   tooltip: {
   trigger: 'axis',
   formatter: function (params) {
   params = params[0];
   var date = new Date(params.name);
   return date.getDate() + '/' + (date.getMonth() + 1) + '/' +
date.getFullYear() + ' : ' + params.value[1];
   },
   axisPointer: {
   animation: false
   }
   },
   xAxis: {
   type: 'time',
   splitLine: {
   show: false
   }
   },
   yAxis: {
   type: 'value',
   boundaryGap: [0, '100%'],
   splitLine: {
   show: false
   }
   },
   series: [{
   name: '模拟数据',
   type: 'line',
   showSymbol: false,
   hoverAnimation: false,
   data: data
   }]
   };

   setInterval(function () {

   for (var i = 0; i < 5; i++) {
   data.shift();
   data.push(randomData());
   }

   myChart.setOption({
   series: [{
   data: data
   }]
   });
   }, 100);

   ```


   ### Other comments [其他信息]


This is an automated message from the Apache Git Service.
To respond to the message, please log on GitHub and use the
URL above to go to the specific comment.

For queries about this service, please contact Infrastructure at:
us...@infra.apache.org


With regards,
Apache Git Services

-
To unsubscribe, e-mail: dev-unsubscr...@echarts.apache.org
For additional commands, e-mail: dev-h...@echarts.apache.org
[GitHub] dounai1306 commented on issue #2540: 3.0地图经纬坐标与当前页面横纵坐标互相获取问题
dounai1306 commented on issue #2540: 3.0地图经纬坐标与当前页面横纵坐标互相获取问题
URL:
https://github.com/apache/incubator-echarts/issues/2540#issuecomment-389105454


   那echarts4有没有类似的方法呢?


This is an automated message from the Apache Git Service.
To respond to the message, please log on GitHub and use the
URL above to go to the specific comment.

For queries about this service, please contact Infrastructure at:
us...@infra.apache.org


With regards,
Apache Git Services

-
To unsubscribe, e-mail: dev-unsubscr...@echarts.apache.org
For additional commands, e-mail: dev-h...@echarts.apache.org
[GitHub] luoshushu commented on issue #2010: Echarts 图表放到bootstrap的tab-panel除过第一个其他的不加载
luoshushu commented on issue #2010: Echarts 图表放到bootstrap的tab-panel除过第一个其他的不加载
URL:
https://github.com/apache/incubator-echarts/issues/2010#issuecomment-389095178


   在myChart设置固定宽高可以解决。


This is an automated message from the Apache Git Service.
To respond to the message, please log on GitHub and use the
URL above to go to the specific comment.

For queries about this service, please contact Infrastructure at:
us...@infra.apache.org


With regards,
Apache Git Services

-
To unsubscribe, e-mail: dev-unsubscr...@echarts.apache.org
For additional commands, e-mail: dev-h...@echarts.apache.org
[GitHub] mmmaomao21 opened a new issue #8343: 拐点图鼠标移入后点变大的比例可以调吗
mmmaomao21 opened a new issue #8343: 拐点图鼠标移入后点变大的比例可以调吗
URL: https://github.com/apache/incubator-echarts/issues/8343


   ### One-line summary [问题简述]

   symbolSize值设大后,鼠标移入后的拐点太大了,能不能设置移入后拐点的大小?


   ### Version & Environment [版本及环境]
   + ECharts version [ECharts 版本]: 3.8.5
   + Browser version [浏览器类型和版本]:
   + OS Version [操作系统类型和版本]:


   ### Expected behaviour [期望结果]


   ### ECharts option [ECharts配置项]


   ```javascript
   option = {

   }

   ```


   ### Other comments [其他信息]


This is an automated message from the Apache Git Service.
To respond to the message, please log on GitHub and use the
URL above to go to the specific comment.

For queries about this service, please contact Infrastructure at:
us...@infra.apache.org


With regards,
Apache Git Services

-
To unsubscribe, e-mail: dev-unsubscr...@echarts.apache.org
For additional commands, e-mail: dev-h...@echarts.apache.org
[GitHub] eskimoblood opened a new issue #8342: How to make the yAxis line on to of bars
eskimoblood opened a new issue #8342: How to make the yAxis line on to of bars
URL: https://github.com/apache/incubator-echarts/issues/8342


   ### One-line summary [问题简述]

   The line of the yAxis lays under the bars in a horizontal bar chart by
default
(https://ecomfe.github.io/echarts-examples/public/editor.html?c=bar-y-category).
 Is there a way to make the bars start not on top but 1px to the right?


This is an automated message from the Apache Git Service.
To respond to the message, please log on GitHub and use the
URL above to go to the specific comment.

For queries about this service, please contact Infrastructure at:
us...@infra.apache.org


With regards,
Apache Git Services

-
To unsubscribe, e-mail: dev-unsubscr...@echarts.apache.org
For additional commands, e-mail: dev-h...@echarts.apache.org
[GitHub] jeffmobiles opened a new issue #8341: svg render异常
jeffmobiles opened a new issue #8341: svg render异常
URL: https://github.com/apache/incubator-echarts/issues/8341


   ### One-line summary [问题简述]
   使用svg Render。 Option 的series的label没有rotate属性时。 只有设置rotate属性才不会报错。
   Uncaught TypeError: Cannot read property '0' of null
   at Object.t.rotate (matrix.js:99)
   at Y (graphic.js:415)
   at Object.S.brush (graphic.js:272)
   at S._paintList (Painter.js:163)
   at S.refresh (Painter.js:140)
   at m.refreshImmediately (zrender.js:237)
   at m.flush (zrender.js:264)
   at Object. (util.js:424)
   at s._update (Animation.js:159)
   at t (Animation.js:169)


   ### Version & Environment [版本及环境]
   + ECharts version [ECharts 版本]:4.1.0
   + Browser version [浏览器类型和版本]:
   + OS Version [操作系统类型和版本]:


   ### Expected behaviour [期望结果]


   ### ECharts option [ECharts配置项]


   ```javascript


   ECharts

   https://cdnjs.cloudflare.com/ajax/libs/echarts/4.1.0/echarts.min.js";>


  // 基于准备好的dom,初始化echarts实例theme, {renderer: render}
  var myChart = echarts.init(document.getElementById('main'), 'light',
{renderer: 'svg'});

   var option = {
"series": [{
"name": "数量",
"type": "pictorialBar",
"data": [42035, 41968, 41789, 41786, 41782, 41780, 41771,
41756, 41755, 41754],
"symbol": "circle",
"symbolSize": [8, 8],
"symbolRepeat": true,
"barGap": 0,
"xAxisIndex": 0,
"z": 5,
   "zlevel": 5,
"yAxisIndex": 0,
"itemStyle": {}
}, {
"name": "",
"type": "pictorialBar",
"data": [84070, 84070, 84070, 84070, 84070, 84070, 84070,
84070, 84070, 84070],
"symbol": "circle",
"symbolSize": [8, 8],
"symbolRepeat": true,
"barGap": "-100%",
"xAxisIndex": 0,
"z": 2,
"zlevel": 2,
"xAxisIndex": 0,
   "yAxisIndex": 0,
   label: {
 show: true,
 formatter: '{c}'
   },
"itemStyle": {
"show": true,
"opacity": 0.5,
"color": "rgba(255,255,255,.3)"
}
}],
"title": {
"text": "最近30分钟Class异常数Top 10",
"textStyle": {
"color": "#fff",
"fontSize": 12,
"fontWeight": "normal"
}
},
"xAxis": [{
"type": "value",
"show": false,
"position": "top",
"splitLine": {
"show": false
}
}],
"yAxis": [{
"type": "category",
"data": ["ender.H1", "H5.H2", "H3", "I4", "L5", "N7", "A75",
"P23", "H5.P8", "T9"],
"inverse": true,
"z": 10,
"zlevel": 10,
"splitLine": {
"show": false
},
"axisLabel": {
"show": true,
"inside": false,
"color": "#fff"
}
}],
"grid": [{
"containLabel": true,
"show": false,
"left": "5%",
"top": 20
}]
   }
 // 基于准备好的dom,初始化echarts实例
 myChart.setOption(option, true)


   ```


   ### Other comments [其他信息]


This is an automated message from the Apache Git Service.
To respond to the message, please log on GitHub and use the
URL above to go to the specific comment.

For queries about this service, please contact Infrastructure at:
us...@infra.apache.org


With regards,
Apache Git Services

-
To unsubscribe, e-mail: dev-unsubscr...@echarts.apache.org
For additional commands, e-mail: dev-h...@echarts.apache.org
[GitHub] wunayou commented on issue #8339: 一个很低级的BUG 折线图 单个name 文本的样式设置不了
wunayou commented on issue #8339: 一个很低级的BUG 折线图  单个name 文本的样式设置不了
URL:
https://github.com/apache/incubator-echarts/issues/8339#issuecomment-389067037


   没有找到 这个文件的位置 所以不能提PR了


This is an automated message from the Apache Git Service.
To respond to the message, please log on GitHub and use the
URL above to go to the specific comment.

For queries about this service, please contact Infrastructure at:
us...@infra.apache.org


With regards,
Apache Git Services

-
To unsubscribe, e-mail: dev-unsubscr...@echarts.apache.org
For additional commands, e-mail: dev-h...@echarts.apache.org
[GitHub] wunayou opened a new issue #8339: 一个很低级版本的BUG 折线图 单个name 文本的样式设置不了
wunayou opened a new issue #8339: 一个很低级版本的BUG 折线图  单个name 文本的样式设置不了
URL: https://github.com/apache/incubator-echarts/issues/8339


   ### One-line summary [问题简述]
   第一步打开官网的DEMO
   http://echarts.baidu.com/examples/editor.html?c=line-simple

   第二步 改数据
   `option = {
   xAxis: {
   type: 'category',
   data: [{value:'123',textStyle:{color:'red'}}, 'Tue', 'Wed', 'Thu',
'Fri', 'Sat', 'Sun']
   },
   yAxis: {
   type: 'value'
   },
   series: [{
   data: [820, 932, 901, 934, 1290, 1330, 1320],
   type: 'line'
   }]
   };
   `
   把DATA的数据 改成对象 然后运行 ,字体变成红色了

   但是 我如果改成 把red 变成“#212121” 就没有效果了?
   `option = {
   xAxis: {
   type: 'category',
   data: [{value:'123',textStyle:{color:'#212121'}}, 'Tue', 'Wed',
'Thu', 'Fri', 'Sat', 'Sun']
   },
   yAxis: {
   type: 'value'
   },
   series: [{
   data: [820, 932, 901, 934, 1290, 1330, 1320],
   type: 'line'
   }]
   };
   `


   ### Version & Environment [版本及环境]
   + ECharts version [ECharts 版本]:
   + Browser version [浏览器类型和版本]:
   + OS Version [操作系统类型和版本]:

   版本用的 4.0
   浏览器chrome


   ### Expected behaviour [期望结果]

   期望可以改成 非英文的 颜色


   ### ECharts option [ECharts配置项]


   ```javascript
   option = {
   xAxis: {
   type: 'category',
   data: [{value:'123',textStyle:{color:'#212121'}}, 'Tue', 'Wed',
'Thu', 'Fri', 'Sat', 'Sun']
   },
   yAxis: {
   type: 'value'
   },
   series: [{
   data: [820, 932, 901, 934, 1290, 1330, 1320],
   type: 'line'
   }]
   };

   ```

   ### Other comments [其他信息]


This is an automated message from the Apache Git Service.
To respond to the message, please log on GitHub and use the
URL above to go to the specific comment.

For queries about this service, please contact Infrastructure at:
us...@infra.apache.org


With regards,
Apache Git Services

-
To unsubscribe, e-mail: dev-unsubscr...@echarts.apache.org
For additional commands, e-mail: dev-h...@echarts.apache.org
[GitHub] zx69 opened a new issue #8338: 数据堆叠时最大值计算错误
zx69 opened a new issue #8338: 数据堆叠时最大值计算错误
URL: https://github.com/apache/incubator-echarts/issues/8338


   ### One-line summary [问题简述]
   项目中同时采用stack数据堆叠、series.data数据分组,结果柱状图的高度超出yAxis的最大值,突出图表。
   配置项如下:
   ```
   option = {
 "title": {
   "text": "每日各工位分时执行量统计"
 },
 "color": [
   "#91c7ae",
   "#c23531",
   "#6e7074",
   "#749f83",
   "#d48265",
   "#2f4554",
   "#61a0a8",
   "#ca8622",
   "#546570",
   "#bda29a",
   "#c4ccd3"
 ],
 "tooltip": {
   "trigger": "axis",
   "axisPointer": {
 "type": "cross",
 "label": {
   "precision": 0
 },
 "crossStyle": {
   "color": "#999"
 }
   }
 },
 "legend": {
   "right": 0,
   "data": [
 "入库单数",
 "出库单数",
 "盘点单数",
 "入库SKU数",
 "出库SKU数",
 "盘点SKU数"
   ]
 },
 "xAxis": [
   {
 "data": [
   "05-15-00时",
   "05-15-01时",
   "05-15-02时",
   "05-15-03时",
   "05-15-04时",
   "05-15-05时",
   "05-15-06时",
   "05-15-07时",
   "05-15-08时",
   "05-15-09时",
   "05-15-10时",
   "05-15-11时",
   "05-15-12时",
   "05-15-13时",
   "05-15-14时",
   "05-15-15时",
   "05-15-16时",
   "05-15-17时",
   "05-15-18时",
   "05-15-19时",
   "05-15-20时",
   "05-15-21时",
   "05-15-22时",
   "05-15-23时",
   "05-12-00时",
   "05-12-01时",
   "05-12-02时",
   "05-12-03时",
   "05-12-04时",
   "05-12-05时",
   "05-12-06时",
   "05-12-07时",
   "05-12-08时",
   "05-12-09时",
   "05-12-10时",
   "05-12-11时",
   "05-12-12时",
   "05-12-13时",
   "05-12-14时",
   "05-12-15时",
   "05-12-16时",
   "05-12-17时",
   "05-12-18时",
   "05-12-19时",
   "05-12-20时",
   "05-12-21时",
   "05-12-22时",
   "05-12-23时",
   "05-04-00时",
   "05-04-01时",
   "05-04-02时",
   "05-04-03时",
   "05-04-04时",
   "05-04-05时",
   "05-04-06时",
   "05-04-07时",
   "05-04-08时",
   "05-04-09时",
   "05-04-10时",
   "05-04-11时",
   "05-04-12时",
   "05-04-13时",
   "05-04-14时",
   "05-04-15时",
   "05-04-16时",
   "05-04-17时",
   "05-04-18时",
   "05-04-19时",
   "05-04-20时",
   "05-04-21时",
   "05-04-22时",
   "05-04-23时",
   "05-03-00时",
   "05-03-01时",
   "05-03-02时",
   "05-03-03时",
   "05-03-04时",
   "05-03-05时",
   "05-03-06时",
   "05-03-07时",
   "05-03-08时",
   "05-03-09时",
   "05-03-10时",
   "05-03-11时",
   "05-03-12时",
   "05-03-13时",
   "05-03-14时",
   "05-03-15时",
   "05-03-16时",
   "05-03-17时",
   "05-03-18时",
   "05-03-19时",
   "05-03-20时",
   "05-03-21时",
   "05-03-22时",
   "05-03-23时"
 ],
 "axisPointer": {
   "type": "shadow"
 }
   }
 ],
 "yAxis": [
   {
 "type": "value",
 "name": "处理单数",
 "axisLabel": {
   "formatter": "{value}单"
 }
   },
   {
 "type": "value",
 "name": "处理SKU数",
 "axisLabel": {
   "formatter": "{value}件"
 }
   }
 ],
 "series": [
   {
 "name": "出库单数",
 "type": "bar",
 "yAxisIndex": 0,
 "stack": "出库单数",
 "itemStyle": {
   "color": "#c23531"
 },
 "data": [
   [
 "05-15-10时",
 3,
 "STATIONA"
   ],
   [
 "05-15-10时",
 3,
 "STATIONA"
   ]
 ]
   },
   {
 "name": "出库SKU数",
 "type": "bar",
 "yAxisIndex": 1,
 "stack": "出库SKU数",
 "itemStyle": {
   "color": "#d48265"
 },
 "data": [
   [
 "05-15-10时",
 3,
 "STATIONA"
   ],
   [
 "05-15-10时",
 3,
 "STATIONA"
   ]
 ]
   },
   {
 "name": "盘点单数",
 "type": "bar",
 "yAxisIndex": 0,
 "stack": "盘点单数",
 "itemStyle": {
   "color": "#546570"
 },
 "data": [
   [
 "05-12-15时",
 1,
 "STATIONC"
   ]
 ]
   },
   {
 "name": "盘点SKU数",
 "type": "bar",
 "yAxisIndex": 1,
 "stack": "盘点SKU数",
 "itemStyle": {
   "color": "#2f4554"
 },
[GitHub] MerlChen opened a new issue #8337: 【急急急---Stacked Line Chart -- 数据点不准确标记】
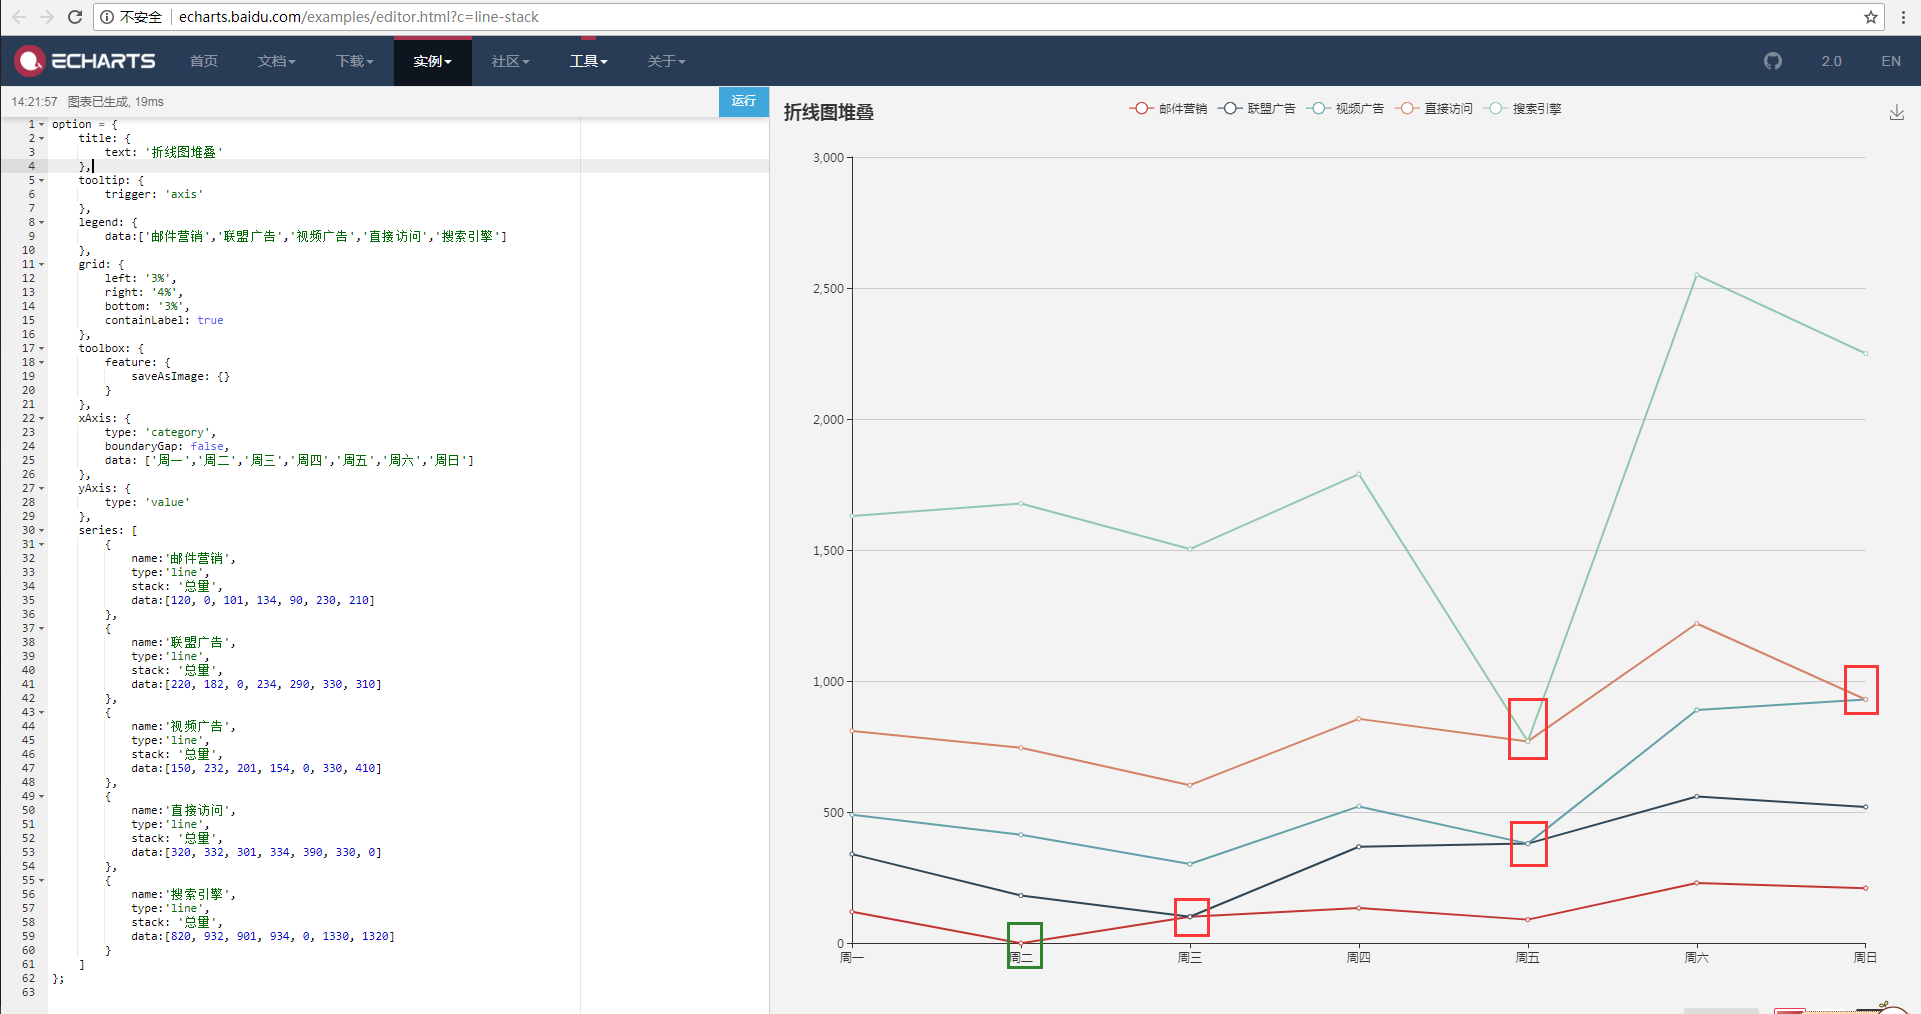
MerlChen opened a new issue #8337: 【急急急---Stacked Line Chart -- 数据点不准确标记】
URL: https://github.com/apache/incubator-echarts/issues/8337
### One-line summary [问题简述]
当某一个点的值为0时,数据点会到其他对应X轴的其他点上去,而不是到Y轴的0点坐标
### Version & Environment [版本及环境]
+ ECharts version [ECharts 版本]: 3.0
+ Browser version [浏览器类型和版本]: GoogleChrome 66.0.3359.170(正式版本) (32 位)
+ OS Version [操作系统类型和版本]: Windows7 旗舰版 64Bit
### Expected behaviour [期望结果]
数据点准确显示
### ECharts option [ECharts配置项]
```javascript
option = {
title: {
text: '折线图堆叠'
},
tooltip: {
trigger: 'axis'
},
legend: {
data:['邮件营销','联盟广告','视频广告','直接访问','搜索引擎']
},
grid: {
left: '3%',
right: '4%',
bottom: '3%',
containLabel: true
},
toolbox: {
feature: {
saveAsImage: {}
}
},
xAxis: {
type: 'category',
boundaryGap: false,
data: ['周一','周二','周三','周四','周五','周六','周日']
},
yAxis: {
type: 'value'
},
series: [
{
name:'邮件营销',
type:'line',
stack: '总量',
data:[120, 0, 101, 134, 90, 230, 210]
},
{
name:'联盟广告',
type:'line',
stack: '总量',
data:[220, 182, 0, 234, 290, 330, 310]
},
{
name:'视频广告',
type:'line',
stack: '总量',
data:[150, 232, 201, 154, 0, 330, 410]
},
{
name:'直接访问',
type:'line',
stack: '总量',
data:[320, 332, 301, 334, 390, 330, 0]
},
{
name:'搜索引擎',
type:'line',
stack: '总量',
data:[820, 932, 901, 934, 0, 1330, 1320]
}
]
};
```
### Other comments [其他信息]
```
求紧急处理一下,或者线上求教:
QQ:379181273
```
This is an automated message from the Apache Git Service.
To respond to the message, please log on GitHub and use the
URL above to go to the specific comment.
For queries about this service, please contact Infrastructure at:
us...@infra.apache.org
With regards,
Apache Git Services
-
To unsubscribe, e-mail: dev-unsubscr...@echarts.apache.org
For additional commands, e-mail: dev-h...@echarts.apache.org