[GitHub] pissang closed issue #6607: IE8不支持富文本rich配置
pissang closed issue #6607: IE8不支持富文本rich配置
URL: https://github.com/apache/incubator-echarts/issues/6607


This is an automated message from the Apache Git Service.
To respond to the message, please log on GitHub and use the
URL above to go to the specific comment.

For queries about this service, please contact Infrastructure at:
us...@infra.apache.org


With regards,
Apache Git Services

-
To unsubscribe, e-mail: dev-unsubscr...@echarts.apache.org
For additional commands, e-mail: dev-h...@echarts.apache.org
[GitHub] HuanMeng0 commented on issue #3116: 请问下现在有没有关于3.0版的bmap部分文档
HuanMeng0 commented on issue #3116: 请问下现在有没有关于3.0版的bmap部分文档
URL:
https://github.com/apache/incubator-echarts/issues/3116#issuecomment-395641031


   mapStyle.StyleJson 可以通过官方的工具生成,可以导入已有的官方模板。
   http://lbsyun.baidu.com/custom/


This is an automated message from the Apache Git Service.
To respond to the message, please log on GitHub and use the
URL above to go to the specific comment.

For queries about this service, please contact Infrastructure at:
us...@infra.apache.org


With regards,
Apache Git Services

-
To unsubscribe, e-mail: dev-unsubscr...@echarts.apache.org
For additional commands, e-mail: dev-h...@echarts.apache.org
[GitHub] SidKwok commented on issue #7499: type:custom,不显示legend
SidKwok commented on issue #7499:   type:custom,不显示legend
URL:
https://github.com/apache/incubator-echarts/issues/7499#issuecomment-395634663


   @pissang 你的意思是去掉`legend`里面的 `data` 吗


This is an automated message from the Apache Git Service.
To respond to the message, please log on GitHub and use the
URL above to go to the specific comment.

For queries about this service, please contact Infrastructure at:
us...@infra.apache.org


With regards,
Apache Git Services

-
To unsubscribe, e-mail: dev-unsubscr...@echarts.apache.org
For additional commands, e-mail: dev-h...@echarts.apache.org
[GitHub] daniellin01 opened a new issue #8489: geo.label.formatter 无效
daniellin01 opened a new issue #8489: geo.label.formatter 无效
URL: https://github.com/apache/incubator-echarts/issues/8489


   ### One-line summary [问题简述]
   配置项 geo.label.formatter 无效  console.log()语句都不运行
   ```
 label: {
   normal: {
 show: false,
 formatter: function(params) {
   console.log(params)
   return nameMap[params.name]
 }
   },
   emphasis: {
 show: true,
 color: '#fff'
   }
 },
   ```
   在echarts 3.8.5版本这配置项是没有问题的

   ### Version & Environment [版本及环境]
   + ECharts version [ECharts 版本]: 4.1.0
   + Browser version [浏览器类型和版本]: chrome 66.0.3359.181
   + OS Version [操作系统类型和版本]: Win10


   ### Expected behaviour [期望结果]
   默认label是显示英文国家名  通过一个对照  我想把英文改为中文  但formatter配置项并没有运行


   ### ECharts option [ECharts配置项]


   ```javascript
   option = {
   geo: {
 map: 'world',
 roam: 'move',
 left: 0,
 top: 0,
 right: 0,
 bottom: 0,
 label: {
   normal: {
 show: false,
 formatter: function(params) {
   console.log(params)
   return nameMap[params.name]
 }
   },
   emphasis: {
 show: true,
 color: '#fff'
   }
 },
 itemStyle: {
   normal: {
 borderWidth: 1,
 borderColor: '#9b9b9c',
 color: '#1c296f'
   },
   emphasis: {
 areaColor: 'rgb(45, 31, 49)',
 borderWidth: 2,
 borderColor: 'rgb(58, 154, 214)',
 shadowColor: 'rgb(58, 154, 214)',
 shadowBlur: 10
   }
 }
   },
   series: [
 {
   name: this.mapData.loc,
   type: 'lines',
   zlevel: 1,
   symbol: [`image://${circular_green}`],
   symbolSize: 30,
   effect: {
 show: true,
 symbol: 'triangle',
 symbolSize: 12,
 period: 6,
 trailLength: 0
   },
   lineStyle: {
 normal: {
   color: '#fdbe01',
   width: 1.2,
   curveness: 0.3,
   opacity: 1
 }
   },
   data: this.mapData ? this.convertLinesData(this.mapData) : []
 },
 {
   type: 'scatter',
   coordinateSystem: 'geo',
   zlevel: 2,
   symbol: `image://${circular_red}`,
   symbolSize: 30,
   label: {
 normal: {
   show: true,
   position: 'bottom',
   color: '#fff',
   formatter: function(params) {
 return params.data.ipAddress
   }
 },
 emphasis: {
   show: true
 }
   },
   data: this.convertEffectScatterData(this.mapData)
 }
   ]
   }

   ```


   ### Other comments [其他信息]


This is an automated message from the Apache Git Service.
To respond to the message, please log on GitHub and use the
URL above to go to the specific comment.

For queries about this service, please contact Infrastructure at:
us...@infra.apache.org


With regards,
Apache Git Services

-
To unsubscribe, e-mail: dev-unsubscr...@echarts.apache.org
For additional commands, e-mail: dev-h...@echarts.apache.org
[GitHub] limeng90 opened a new issue #8488: 多个data怎么展示在一个图表里面
limeng90 opened a new issue #8488: 多个data怎么展示在一个图表里面
URL: https://github.com/apache/incubator-echarts/issues/8488


   ### One-line summary [问题简述]

比如说下面的data,里面包含3组数据,x轴为cratetime,y为value,怎么在一个图表里面绘制3条线图,其中每组数据的creatime是不同的。配置项series
 和xAxis该怎么配置,找官网实例没找到类似实例,万分感谢。
   let data = [
   [
   {createtime: 1526213605000, value: 10, cate: 1 },
   {createtime: 1526313706000, value: 20 ,cate: 1},
   {createtime: 152641380, value: 30,cate: 1 },
   {createtime: 152631390, value: 40,cate: 1 }
   ],
   [
   {createtime: 152631360, value: 11,cate: 2 },
   {createtime: 1528313806000, value: 22,cate: 2 },
   {createtime: 152631390, value: 33 ,cate: 2},
   {createtime: 152651490, value: 44 ,cate: 2}
   ],
   [
   {createtime: 152731360, value: 15 ,cate: 3},
   {createtime: 152831380, value: 25 ,cate: 3 },
   {createtime: 152641390, value: 36 ,cate: 3 },
   {createtime: 152631690, value: 46 ,cate: 3 }
   ],
   ]


   ### Version & Environment [版本及环境]
   + ECharts version [ECharts 版本]:
   + Browser version [浏览器类型和版本]:
   + OS Version [操作系统类型和版本]:


   ### Expected behaviour [期望结果]

   期望一个图标绘制3条线图


   ### ECharts option [ECharts配置项]


   ```javascript
   option = {

   }

   ```


   ### Other comments [其他信息]


This is an automated message from the Apache Git Service.
To respond to the message, please log on GitHub and use the
URL above to go to the specific comment.

For queries about this service, please contact Infrastructure at:
us...@infra.apache.org


With regards,
Apache Git Services

-
To unsubscribe, e-mail: dev-unsubscr...@echarts.apache.org
For additional commands, e-mail: dev-h...@echarts.apache.org
[GitHub] Alsmile opened a new issue #8487: 最新angular6版本下,无法编译prod环境
Alsmile opened a new issue #8487: 最新angular6版本下,无法编译prod环境
URL: https://github.com/apache/incubator-echarts/issues/8487


   最新angular6版本下,可以在开发环境下运行,但是编译prod失败


This is an automated message from the Apache Git Service.
To respond to the message, please log on GitHub and use the
URL above to go to the specific comment.

For queries about this service, please contact Infrastructure at:
us...@infra.apache.org


With regards,
Apache Git Services

-
To unsubscribe, e-mail: dev-unsubscr...@echarts.apache.org
For additional commands, e-mail: dev-h...@echarts.apache.org
[GitHub] IdenPin commented on issue #3432: echarts3.x地图geojson是否支持绘制线linestring类型
IdenPin commented on issue #3432: echarts3.x地图geojson是否支持绘制线linestring类型
URL:
https://github.com/apache/incubator-echarts/issues/3432#issuecomment-395428140


   @pissang请问linestring现在支持了吗?


This is an automated message from the Apache Git Service.
To respond to the message, please log on GitHub and use the
URL above to go to the specific comment.

For queries about this service, please contact Infrastructure at:
us...@infra.apache.org


With regards,
Apache Git Services

-
To unsubscribe, e-mail: dev-unsubscr...@echarts.apache.org
For additional commands, e-mail: dev-h...@echarts.apache.org
[GitHub] pissang closed issue #8485: 赤尾屿和南海诸岛不显示?
pissang closed issue #8485: 赤尾屿和南海诸岛不显示?
URL: https://github.com/apache/incubator-echarts/issues/8485


This is an automated message from the Apache Git Service.
To respond to the message, please log on GitHub and use the
URL above to go to the specific comment.

For queries about this service, please contact Infrastructure at:
us...@infra.apache.org


With regards,
Apache Git Services

-
To unsubscribe, e-mail: dev-unsubscr...@echarts.apache.org
For additional commands, e-mail: dev-h...@echarts.apache.org
[GitHub] seasolzombie opened a new issue #8485: 赤尾屿和南海群岛不显示?
seasolzombie opened a new issue #8485: 赤尾屿和南海群岛不显示?
URL: https://github.com/apache/incubator-echarts/issues/8485


   ### One-line summary [问题简述]
   中国全图必须表示南海诸岛、钓鱼岛、赤尾屿等重要岛屿,并用相应的符号绘出岛屿归属线--国家测绘局
   我们公司要使用echart做一个地图,但是插件里面根本不显示南海诸岛和赤尾屿等重要岛屿


   ### Version & Environment [版本及环境]v3
   + ECharts version [ECharts 版本]:mac
   + Browser version [浏览器类型和版本]:chrome 63
   + OS Version [操作系统类型和版本]:macOS


   ### Expected behaviour [期望结果]
   显示南海诸岛和赤尾屿等重要岛屿


   ### ECharts option [ECharts配置项]


   ```javascript
   option = {

   }

   ```


   ### Other comments [其他信息]


This is an automated message from the Apache Git Service.
To respond to the message, please log on GitHub and use the
URL above to go to the specific comment.

For queries about this service, please contact Infrastructure at:
us...@infra.apache.org


With regards,
Apache Git Services

-
To unsubscribe, e-mail: dev-unsubscr...@echarts.apache.org
For additional commands, e-mail: dev-h...@echarts.apache.org
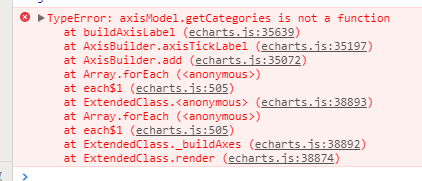
[GitHub] caixing200 opened a new issue #8484: 微信小程序_雷达图的轴标签值无法显示
caixing200 opened a new issue #8484: 微信小程序_雷达图的轴标签值无法显示
URL: https://github.com/apache/incubator-echarts/issues/8484
### One-line summary [问题简述]
微信小程序项目需要用到雷达图,其中原型上有需求在雷达图的轴线上显示标签值,按官方配置教程使用会报错。
### Version & Environment [版本及环境]微信小程序,基础库版本2.0.0
+ ECharts version [ECharts 版本]:V4.0.3; V4.0.4; V4.1.0.RC2
+ Browser version [浏览器类型和版本]:微信开发者工具
+ OS Version [操作系统类型和版本]:WIN10 1709
### Expected behaviour [期望结果]
### ECharts option [ECharts配置项]
```javascript
option = {
backgroundColor: "#ff",
color: ["#FF9F7F", "#04c38e"],
legend: [{
left: '10%',
top: 32,
selectedMode: false,
formatter: '{a|{name}}',
textStyle:{
rich: {
a:{
color: '#ff',
fontWeight: 600,
fontSize: 16
}
}
},
data: [{name: '自测'}]
},
{
right: '10%',
top: 25,
selectedMode: false,
formatter: ['{a|参测企业}','{a|平均值}'].join('\n'),
textStyle: {
rich: {
a: {
color: '#000',
fontWeight: 600,
fontSize: 16,
width:30
}
}
},
data: [{name:'参测企业平均值'}]
}],
radar: {
// shape: 'circle',
indicator: [{
name: '销售',
max: 20,
color: '#000',
axisLine: {
lineStyle: {
color: '#ff'
}
},
axisTick: {
show: true
},
axisLabel: {
show: true,
formatter: function (value, index) {
return value;
}
}
},
{
name: '仓储',
max: 20,
color: '#000'
},
{
name: '管理',
max: 20,
color: '#000'
},
{
name: '生产',
max: 20,
color: '#000'
},
{
name: '采购',
max: 20,
color: '#000'
}
]
},
series: [{
type: 'radar',
itemStyle: { normal: { areaStyle: { type: 'default' } } },
data: [{
value: [10, 14, 10, 13, 19, 10],
name: '参测企业平均值'
},
{
value: [13, 10, 15, 10, 12, 12],
name: '自测'
}
]
}]
}
```
### Other comments [其他信息]
This is an automated message from the Apache Git Service.
To respond to the message, please log on GitHub and use the
URL above to go to the specific comment.
For queries about this service, please contact Infrastructure at:
us...@infra.apache.org
With regards,
Apache Git Services
-
To unsubscribe, e-mail: dev-unsubscr...@echarts.apache.org
For additional commands, e-mail: dev-h...@echarts.apache.org
[GitHub] plus-zhang commented on issue #1287: 为什么折线图的y轴比例不对,比如数值是13,对的y轴是26,为什么?
plus-zhang commented on issue #1287: 为什么折线图的y轴比例不对,比如数值是13,对的y轴是26,为什么?
URL:
https://github.com/apache/incubator-echarts/issues/1287#issuecomment-395344800


   @jiabinxiong 真神奇


This is an automated message from the Apache Git Service.
To respond to the message, please log on GitHub and use the
URL above to go to the specific comment.

For queries about this service, please contact Infrastructure at:
us...@infra.apache.org


With regards,
Apache Git Services

-
To unsubscribe, e-mail: dev-unsubscr...@echarts.apache.org
For additional commands, e-mail: dev-h...@echarts.apache.org
[GitHub] lxzmxl commented on issue #6224: Error: Component series.force not exists. Load it first.
lxzmxl commented on issue #6224: Error: Component series.force not exists. Load
it first.
URL:
https://github.com/apache/incubator-echarts/issues/6224#issuecomment-395341836


   请问最后问题怎么解决?你解决了吗


This is an automated message from the Apache Git Service.
To respond to the message, please log on GitHub and use the
URL above to go to the specific comment.

For queries about this service, please contact Infrastructure at:
us...@infra.apache.org


With regards,
Apache Git Services

-
To unsubscribe, e-mail: dev-unsubscr...@echarts.apache.org
For additional commands, e-mail: dev-h...@echarts.apache.org
[GitHub] ggxxsol opened a new issue #8483: 使用柱状图特效时,柱状图显示不全,呈现一个三角的情况
ggxxsol opened a new issue #8483: 使用柱状图特效时,柱状图显示不全,呈现一个三角的情况
URL: https://github.com/apache/incubator-echarts/issues/8483


   ### One-line summary [问题简述]
   特定分辨率下,柱状图会显示不全,呈现一个三角的情况
   此问题在添加阴影时出现,出现方式为不断更改浏览器的分辨率
   ,例如
itemStyle: {
   normal: {
 color: 'gray',
 shadowColor: 'rgba(0, 0, 0, 0.5)',
 shadowBlur: 10,
 barBorderRadius: [3, 3, 0, 0],
   },
 },


   ### Version & Environment [版本及环境]
   + ECharts version [ECharts 版本]:v4.1.0.rc2
   + Browser version [浏览器类型和版本]:firefox chrome等多个浏览器
   + OS Version [操作系统类型和版本]:window8 windows7


   ### Expected behaviour [期望结果]
   使用阴影等特效不要出现此bug


   ### ECharts option [ECharts配置项]


   参考官方实例
   http://echarts.baidu.com/examples/editor.html?c=multiple-y-axis

   在此实例中,修改series部分为以下内容,并且缓慢拖动浏览器窗口即可发现
   series: [
   {
   itemStyle: {
   normal: {
 color: 'gray',
 shadowColor: 'rgba(0, 0, 0, 0.5)',
 shadowBlur: 10,
 barBorderRadius: [3, 3, 0, 0],
   },
 },
   itemStyle: {
   normal: {
 color: 'gray',
 shadowColor: 'rgba(0, 0, 0, 0.5)',
 shadowBlur: 10,
 barBorderRadius: [3, 3, 0, 0],
   },
 },
   name:'蒸发量',
   type:'bar',
   data:[2.0, 4.9, 7.0, 23.2, 25.6, 76.7, 135.6, 162.2, 32.6, 20.0,
6.4, 3.3]
   },
   {
 itemStyle: {
   normal: {
 color: 'gray',
 shadowColor: 'rgba(0, 0, 0, 0.5)',
 shadowBlur: 10,
 barBorderRadius: [3, 3, 0, 0],
   },
 },
   name:'降水量',
   type:'bar',
   yAxisIndex: 1,
   data:[2.6, 5.9, 9.0, 26.4, 28.7, 70.7, 175.6, 182.2, 48.7, 18.8,
6.0, 2.3]
   },
   {
   name:'平均温度',
   type:'line',
   yAxisIndex: 2,
   data:[2.0, 2.2, 3.3, 4.5, 6.3, 10.2, 20.3, 23.4, 23.0, 16.5,
12.0, 6.2]
   }
   ]

   ```


   ### Other comments [其他信息]


This is an automated message from the Apache Git Service.
To respond to the message, please log on GitHub and use the
URL above to go to the specific comment.

For queries about this service, please contact Infrastructure at:
us...@infra.apache.org


With regards,
Apache Git Services

-
To unsubscribe, e-mail: dev-unsubscr...@echarts.apache.org
For additional commands, e-mail: dev-h...@echarts.apache.org
Re: any release plan for next release?
The next release will include

- SVG map supporting
- Tree roam
- Custom series performance enhancement
- Other minor bug fixes.

Should we put the feature plan somewhere?
For example, "Github project tab"?


--
 Su Shuang (100pah)
--


2018-06-06 15:44 GMT+08:00 Tan,Zhongyi :

> Hi,guys,
>
> Any feature list or bug list for next release?
>
> So we know that it will be released regularly.
>
> Thanks
>
>
>
[GitHub] Bonjourjw opened a new issue #8482: makePoint的symbol如何高亮显示
Bonjourjw opened a new issue #8482: makePoint的symbol如何高亮显示
URL: https://github.com/apache/incubator-echarts/issues/8482


One-line summary [问题简述]
   如何使makePoint和折线的拐点symbol一样,当鼠标hover触发,小圆圈变大高亮显示


   上图中的两个symbo是将原本折线的symbol屏蔽后,利用makePoint实现的,但是默认的选中动却不存在了。


   ### Veonment [版本及环境]
   + ECharts version [ECharts 版本]: echarts3
   + Browser version [浏览器类型和版本]: chrome
   + OS Version [操作系统类型和版本]:win7


   ### Expected behaviour [期望结果]

   鼠标放置在该点是可以和yuanla原来一样高亮变大


   ### ECharts option [ECharts配置项]

   ```


   ### Other comments [其他信息]


This is an automated message from the Apache Git Service.
To respond to the message, please log on GitHub and use the
URL above to go to the specific comment.

For queries about this service, please contact Infrastructure at:
us...@infra.apache.org


With regards,
Apache Git Services

-
To unsubscribe, e-mail: dev-unsubscr...@echarts.apache.org
For additional commands, e-mail: dev-h...@echarts.apache.org
[GitHub] jasperjiang0204 commented on issue #4749: 力导图拖拽问题
jasperjiang0204 commented on issue #4749: 力导图拖拽问题
URL:
https://github.com/apache/incubator-echarts/issues/4749#issuecomment-395324146


   想了好久了都没找到答案。。解决了吗


This is an automated message from the Apache Git Service.
To respond to the message, please log on GitHub and use the
URL above to go to the specific comment.

For queries about this service, please contact Infrastructure at:
us...@infra.apache.org


With regards,
Apache Git Services

-
To unsubscribe, e-mail: dev-unsubscr...@echarts.apache.org
For additional commands, e-mail: dev-h...@echarts.apache.org
[GitHub] jasperjiang0204 opened a new issue #8480: echarts中graph图拖拽某一个点之后,点到了拽到的位置不再弹回去
jasperjiang0204 opened a new issue #8480: echarts中graph图拖拽某一个点之后,点到了拽到的位置不再弹回去
URL: https://github.com/apache/incubator-echarts/issues/8480


   ### One-line summary [我使用了echarts中graph具体的Les
Miserables范例,每次想拖拽一个点然后仔细观察结构时,松开鼠标,点都会弹回去,如何实现拖拽之后点停留住,不自动弹回去]


   ### Version & Environment [版本及环境]
   + ECharts version [ECharts 版本]:
   + Browser version [浏览器类型和版本]:
   + OS Version [操作系统类型和版本]:


   ### Expected behaviour [期望结果]


   ### ECharts option [ECharts配置项]


   ```javascript
   option = {

   }

   ```


   ### Other comments [其他信息]


This is an automated message from the Apache Git Service.
To respond to the message, please log on GitHub and use the
URL above to go to the specific comment.

For queries about this service, please contact Infrastructure at:
us...@infra.apache.org


With regards,
Apache Git Services

-
To unsubscribe, e-mail: dev-unsubscr...@echarts.apache.org
For additional commands, e-mail: dev-h...@echarts.apache.org
[GitHub] huangenzi opened a new issue #8479: echarts怎么让刷新图表数据后 datazoom保持在之前拖拽到的位置
huangenzi opened a new issue #8479: echarts怎么让刷新图表数据后 datazoom保持在之前拖拽到的位置
URL: https://github.com/apache/incubator-echarts/issues/8479


   ### One-line summary [问题简述]

   echarts怎么让刷新图表数据后 datazoom保持在之前拖拽到的位置


   ### Version & Environment [版本及环境]
   + ECharts version [ECharts 版本]:
   + Browser version [浏览器类型和版本]:
   + OS Version [操作系统类型和版本]:


   ### Expected behaviour [期望结果]

   刷新图表数据后 datazoom保持在之前拖拽到的位置


   ### ECharts option [ECharts配置项]


   ```javascript
   option = {

   }

   ```


   ### Other comments [其他信息]


This is an automated message from the Apache Git Service.
To respond to the message, please log on GitHub and use the
URL above to go to the specific comment.

For queries about this service, please contact Infrastructure at:
us...@infra.apache.org


With regards,
Apache Git Services

-
To unsubscribe, e-mail: dev-unsubscr...@echarts.apache.org
For additional commands, e-mail: dev-h...@echarts.apache.org
Re: Request for Apache Website server
Hi John,

I created an index.html file under asf-site branch (
https://github.com/apache/incubator-echarts-website/blob/asf-site/index.html
), but apparently it is not hosted at https://echarts.apache.org/index.html
.

The doc ( http://www.apache.org/dev/project-site.html ) says that "Typically
these will be built as a jenkins job or a buildbot job". I wonder if this
is compulsive, since currently we use gulp.js and Node.js to generate our
website, and we'd prefer to have our generated static files hosted.
In this case, should we use jenkins or buildbot job? Besides, I didn't see
detail information about how to use the tools along with GitHub asf-site
branch. Could you please explain it to us?

Thanks for your time!

Zhang Wenli
http://zhangwenli.com

On Fri, Jun 1, 2018 at 10:45 AM, Wenli Zhang  wrote:

> Hi John,
>
> I managed to push to the repo. Thanks!
>
> Zhang Wenli
> http://zhangwenli.com
>
> On Fri, Jun 1, 2018 at 9:14 AM, John D. Ament
> wrote:
>
>> Could you double check? The repo is empty, so needs something pushed to
>> it.
>>
>> John
>>
>> On Wed, May 30, 2018 at 11:07 PM Wenli Zhang
>> wrote:
>>
>> > Hi John,
>> >
>> > Thanks for reply.
>> >
>> > You mentioned that just created a git repo. I guess that should be
>> > https://github.com/apache/incubator-echarts-website .
>> > But we don't have the access to it, probably admin right is needed.
>> >
>> > Thanks!
>> >
>> > Zhang Wenli
>> > http://zhangwenli.com
>> >
>> > On Thu, May 31, 2018 at 10:54 AM, John D. Ament
>> > wrote:
>> >
>> > > Sending an email is probably the easiest way to get started.  I
>> believe
>> > > what you did was create a JIRA ticket in our JIRA board, INFRA has
>> their
>> > > own.
>> > >
>> > > Getting a website is a handful of steps.
>> > >
>> > > - Create a git repo created (just did that)
>> > > - Create two branches on the repo.  One that includes the source files
>> > for
>> > > editing, another that includes the final production build.  We
>> typically
>> > > use "master" for the code, and "asf-site" for the build output
>> > > - Create an automated build process so that when someone pushes to
>> > master,
>> > > it builds and places output into asf-site branch.  If you review
>> > > https://github.com/apache/incubator/blob/master/build_site.sh it
>> should
>> > > give you a general understanding of how that works.  This script is
>> run
>> > > from Jenkins.
>> > > - Once we have that build in place, we can ask INFRA to serve our
>> > asf-site
>> > > branch as the website for echarts.incubator.apache.org
>> > >
>> > > Let me know if that works.
>> > >
>> > > John
>> > >
>> > >
>> > > On Wed, May 30, 2018 at 10:48 PM Wenli Zhang
>> > > wrote:
>> > >
>> > > > Hi,
>> > > >
>> > > > We'd like to request for Apache Website server for
>> > > > http://echarts.incubator.apache.org/ .
>> > > >
>> > > > We want to use gitpubsub, so how can we create this git repo?
>> > > >
>> > > > I created this issue
>> > > >
>> > > > https://issues.apache.org/jira/projects/ECHARTS/issues/
>> > > ECHARTS-1?filter=allopenissues
>> > > > but no one replied. So I guess I need to send this email to discuss
>> > about
>> > > > it.
>> > > >
>> > > > Thanks!
>> > > >
>> > > > Zhang Wenli
>> > > > http://zhangwenli.com
>> > > >
>> > >
>> >
>>
>
>