dbb1016606796 commented on issue #17058:
URL: https://github.com/apache/echarts/issues/17058#issuecomment-1129558320
> 那还真有可能跟 GPU 有关系。记得之前有开发者反馈渲染问题,一般禁用 GPU 加速可能就好了。
>
> > 1、浏览器地址栏输入:chrome://flags/#disable-accelerated-2d-canvas
> > 2、选择“Disabled”
> > 3、重启浏览器。
dbb1016606796 commented on issue #17058:
URL: https://github.com/apache/echarts/issues/17058#issuecomment-1129538515
> 禁用 GPU 加速
我觉得真的可能是这个原因,我的是有显卡的正常,出问题的都是没有显卡的机器,使用cpu自带显卡的都会出现锯齿
--
This is an automated message from the Apache Git Service.
To respond to the message, please log
plainheart commented on issue #17058:
URL: https://github.com/apache/echarts/issues/17058#issuecomment-1129535875
那还真有可能跟 GPU 有关系。记得之前有开发者反馈渲染问题,一般禁用 GPU 加速可能就好了。
> 1、浏览器地址栏输入:chrome://flags/#disable-accelerated-2d-canvas
> 2、选择“Disabled”
> 3、重启浏览器。
--
This is an automated
dbb1016606796 commented on issue #17058:
URL: https://github.com/apache/echarts/issues/17058#issuecomment-1129533659
> 我这边没有复现该问题
我的aoc显示器也是没问题,但是测试的Dell显示器就出现了这个问题,崩溃了,难不成是不同的液晶材质导致的吗
--
This is an automated message from the Apache Git Service.
To respond to the message, please
plainheart commented on issue #17058:
URL: https://github.com/apache/echarts/issues/17058#issuecomment-1129533041
我这边没有复现该问题
--
This is an automated message from the Apache Git Service.
To respond to the message, please log on to GitHub and use the
URL above to go to the specific comment.
echarts-bot[bot] commented on issue #17058:
URL: https://github.com/apache/echarts/issues/17058#issuecomment-1129525105
@dbb1016606796 It seems you are not using English, I've helped translate the
content automatically. To make your issue understood by more people and get
helped, we'd like
dbb1016606796 opened a new issue, #17058:
URL: https://github.com/apache/echarts/issues/17058
### Version
5.3.2
### Link to Minimal Reproduction
_No response_
### Steps to Reproduce
jiawulin001 commented on code in PR #16895:
URL: https://github.com/apache/echarts/pull/16895#discussion_r874566052
##
src/coord/Axis.ts:
##
@@ -129,7 +129,12 @@ class Axis {
fixExtentWithBands(extent, (scale as OrdinalScale).count());
}
-return
This is an automated email from the ASF dual-hosted git repository.
wangzx pushed a commit to branch gh-pages
in repository https://gitbox.apache.org/repos/asf/echarts-examples.git
The following commit(s) were added to refs/heads/gh-pages by this push:
new 00e79acc fix(cdn): change the CDN
plainheart commented on issue #17042:
URL: https://github.com/apache/echarts/issues/17042#issuecomment-1129475849
Hi, all. The CDN cache has been updated. Feel free to check if you can
access the website and example page.
--
This is an automated message from the Apache Git Service.
To
hughess commented on issue #7763:
URL: https://github.com/apache/echarts/issues/7763#issuecomment-1129470048
Thanks @plainheart. As a first step to understand how it would work, I did
the following:
- Used the svg renderer as normal to create and display a chart
- Added a custom
jiawulin001 commented on issue #17021:
URL: https://github.com/apache/echarts/issues/17021#issuecomment-1129458806
>However, bar charts uses a category xAxis.
Right, so you might have to use position relative to DOM to locate the gray
bar like what I did in the code sample
stephen-bri commented on issue #3264:
URL: https://github.com/apache/echarts/issues/3264#issuecomment-1129374054
+1
--
This is an automated message from the Apache Git Service.
To respond to the message, please log on to GitHub and use the
URL above to go to the specific comment.
To
Fritzbox2000 opened a new issue, #17057:
URL: https://github.com/apache/echarts/issues/17057
### Version
5.3.2
### Link to Minimal Reproduction
_No response_
### Steps to Reproduce
1. Using Echarts.time.format() with some date (e.g.12th December 2000) and
juliabiesiada opened a new issue, #17056:
URL: https://github.com/apache/echarts/issues/17056
### Version
5.3.0
### Link to Minimal Reproduction
_No response_
### Steps to Reproduce
DispatchAction:
`item.focusFn = () => {
if
teuf22 commented on issue #5833:
URL: https://github.com/apache/echarts/issues/5833#issuecomment-1128868214
Another solution is to use an overlay
```
graphic: {
type: 'text',
left: 'center',
top: 'middle',
style: { text: "No data available" }
}
```
--
sammuell commented on issue #17021:
URL: https://github.com/apache/echarts/issues/17021#issuecomment-1128867911
> Otherwise, you can use `chart.getOptions().grid.height` to get the size of
the grid area.
That does not work either: the height is undefined:
nomego opened a new issue, #17055:
URL: https://github.com/apache/echarts/issues/17055
### What problem does this feature solve?
We want to render financial information from different years with the
amounts on the yAxis and and the month of the year on the xAxis, which works
well
echarts-bot[bot] closed issue #17053: [Bug] The official website source code
error, it appears that the CDN reference library is not available
URL: https://github.com/apache/echarts/issues/17053
--
This is an automated message from the Apache Git Service.
To respond to the message, please
plainheart commented on issue #17053:
URL: https://github.com/apache/echarts/issues/17053#issuecomment-1128852899
Duplicated of #17042. The CDN cache on the Chinese example page has not been
updated yet. Please access the English example page temporarily.
--
This is an automated message
sammuell commented on issue #17021:
URL: https://github.com/apache/echarts/issues/17021#issuecomment-1128850048
Thanks for pointing me to `markArea`.
I implemented it using two xAxis properties. However, the rendered result
does not extend as far as expected (purple lines)
echarts-bot[bot] commented on issue #17054:
URL: https://github.com/apache/echarts/issues/17054#issuecomment-1128810408
@wangnannanziyu It seems you are not using English, I've helped translate
the content automatically. To make your issue understood by more people and get
helped, we'd
wangnannanziyu opened a new issue, #17054:
URL: https://github.com/apache/echarts/issues/17054
### What problem does this feature solve?
需要使用自定义系列实现转化漏斗图,希望legend的name也可以像echarts本身支持漏斗图那样,可以映射到单个数据的name上(或者能映射到renderItem返回的对象的name上),否则legend默认就是映射到series.name
### What does the
fuchunhui commented on issue #17039:
URL: https://github.com/apache/echarts/issues/17039#issuecomment-1128797210
Sorry,I don't understand what you mean exactly, Would you provide a demo for
it.
--
This is an automated message from the Apache Git Service.
To respond to the message, please
echarts-bot[bot] commented on issue #17039:
URL: https://github.com/apache/echarts/issues/17039#issuecomment-1128795857
@zhangzhi93 Please provide a demo for the issue either with [Official
Editor](https://echarts.apache.org/examples/editor.html),
echarts-bot[bot] commented on issue #16965:
URL: https://github.com/apache/echarts/issues/16965#issuecomment-1128792273
@372798735 Please provide a demo for the issue either with [Official
Editor](https://echarts.apache.org/examples/editor.html),
fuchunhui commented on issue #16965:
URL: https://github.com/apache/echarts/issues/16965#issuecomment-1128785474
ECharts 目前不支持你说的这种场景(自动的适应背景高度)。
介于已知信息较少,不确定你目前的实现方案,希望能够补充最小粒度的 Demo,便于问题讨论。
疑问点:Y 轴高度是否固定,是否可以无限往下。【重点】
猜想下,可能的设计思路,使用 bar.markArea 绘制背景,第一个背景固定,第二个通过 柱的个数 *
fuchunhui commented on issue #17049:
URL: https://github.com/apache/echarts/issues/17049#issuecomment-1128739006
试试这个,我没有发现你说的问题呢。
[codesandbox](https://codesandbox.io/s/smoothed-line-chart-forked-j55us9)
julius2zhu opened a new issue, #17053:
URL: https://github.com/apache/echarts/issues/17053
### Version
5.2.2
### Link to Minimal Reproduction
_No response_
### Steps to Reproduce
Unable to view source code
### Current Behavior
Unable to view
Nauxscript opened a new issue, #17052:
URL: https://github.com/apache/echarts/issues/17052
### Version
echarts@5.3.2
### Link to Minimal Reproduction
https://codepen.io/Nauxscript/pen/VwQpwNG
### Steps to Reproduce
use the public example in
jiawulin001 commented on code in PR #16895:
URL: https://github.com/apache/echarts/pull/16895#discussion_r874566052
##
src/coord/Axis.ts:
##
@@ -129,7 +129,12 @@ class Axis {
fixExtentWithBands(extent, (scale as OrdinalScale).count());
}
-return
sweetwisdom commented on issue #17042:
URL: https://github.com/apache/echarts/issues/17042#issuecomment-1128604410
> ### Version
> 5.2.2
>
> ### Link to Minimal Reproduction
> _No response_
>
> ### Steps to Reproduce
> 1. 打开官网
> 2. css样式混乱
>
> ### Current
echarts-bot[bot] commented on issue #17051:
URL: https://github.com/apache/echarts/issues/17051#issuecomment-1128594113
@zhaoyanga It seems you are not using English, I've helped translate the
content automatically. To make your issue understood by more people and get
helped, we'd like to
zhaoyanga opened a new issue, #17051:
URL: https://github.com/apache/echarts/issues/17051
### Version
4.5.0
### Link to Minimal Reproduction
_No response_
### Steps to Reproduce
[Bug] x轴显示固定的12个月份,折线的数据量到天,然后是某三年的对比折线图,我把x轴固定显示12个月份后,折线出不来
###
loadingwyn opened a new issue, #17050:
URL: https://github.com/apache/echarts/issues/17050
### What problem does this feature solve?
Now if I set the data of markarea smaller than line data, users won't see
the area. Because the min of x axis is set to 'dataMin'.
### What does
wutato commented on issue #17042:
URL: https://github.com/apache/echarts/issues/17042#issuecomment-1128573688
还是无法展开样式
--
This is an automated message from the Apache Git Service.
To respond to the message, please log on to GitHub and use the
URL above to go to the specific comment.
To
echarts-bot[bot] commented on issue #17049:
URL: https://github.com/apache/echarts/issues/17049#issuecomment-1128543393
@zhaoyanga It seems you are not using English, I've helped translate the
content automatically. To make your issue understood by more people and get
helped, we'd like to
zhaoyanga opened a new issue, #17049:
URL: https://github.com/apache/echarts/issues/17049
### Version
4.8.0
### Link to Minimal Reproduction
_No response_
### Steps to Reproduce
wutingkuan opened a new issue, #17048:
URL: https://github.com/apache/echarts/issues/17048
### Version
5.2.23
### Link to Minimal Reproduction
_No response_
### Steps to Reproduce
echarts-bot[bot] closed issue #17048: [Bug]
URL: https://github.com/apache/echarts/issues/17048
--
This is an automated message from the Apache Git Service.
To respond to the message, please log on to GitHub and use the
URL above to go to the specific comment.
To unsubscribe, e-mail:
echarts-bot[bot] commented on issue #17048:
URL: https://github.com/apache/echarts/issues/17048#issuecomment-1128528548
I'm sorry to close this issue for it lacks the necessary title. Please
provide **a _descriptive_ and as _concise_ as possible title to describe your
problems or
sunnynono commented on issue #17047:
URL: https://github.com/apache/echarts/issues/17047#issuecomment-1128526261
update problem picture
--
This is an automated message from the Apache Git Service.
To respond to the message, please log on to GitHub and use the
URL above to go to the
sunnynono commented on issue #17047:
URL: https://github.com/apache/echarts/issues/17047#issuecomment-1128525772
echarts-bot[bot] commented on issue #17047:
URL: https://github.com/apache/echarts/issues/17047#issuecomment-1128523726
@sunnynono It seems you are not using English, I've helped translate the
content automatically. To make your issue understood by more people and get
helped, we'd like to
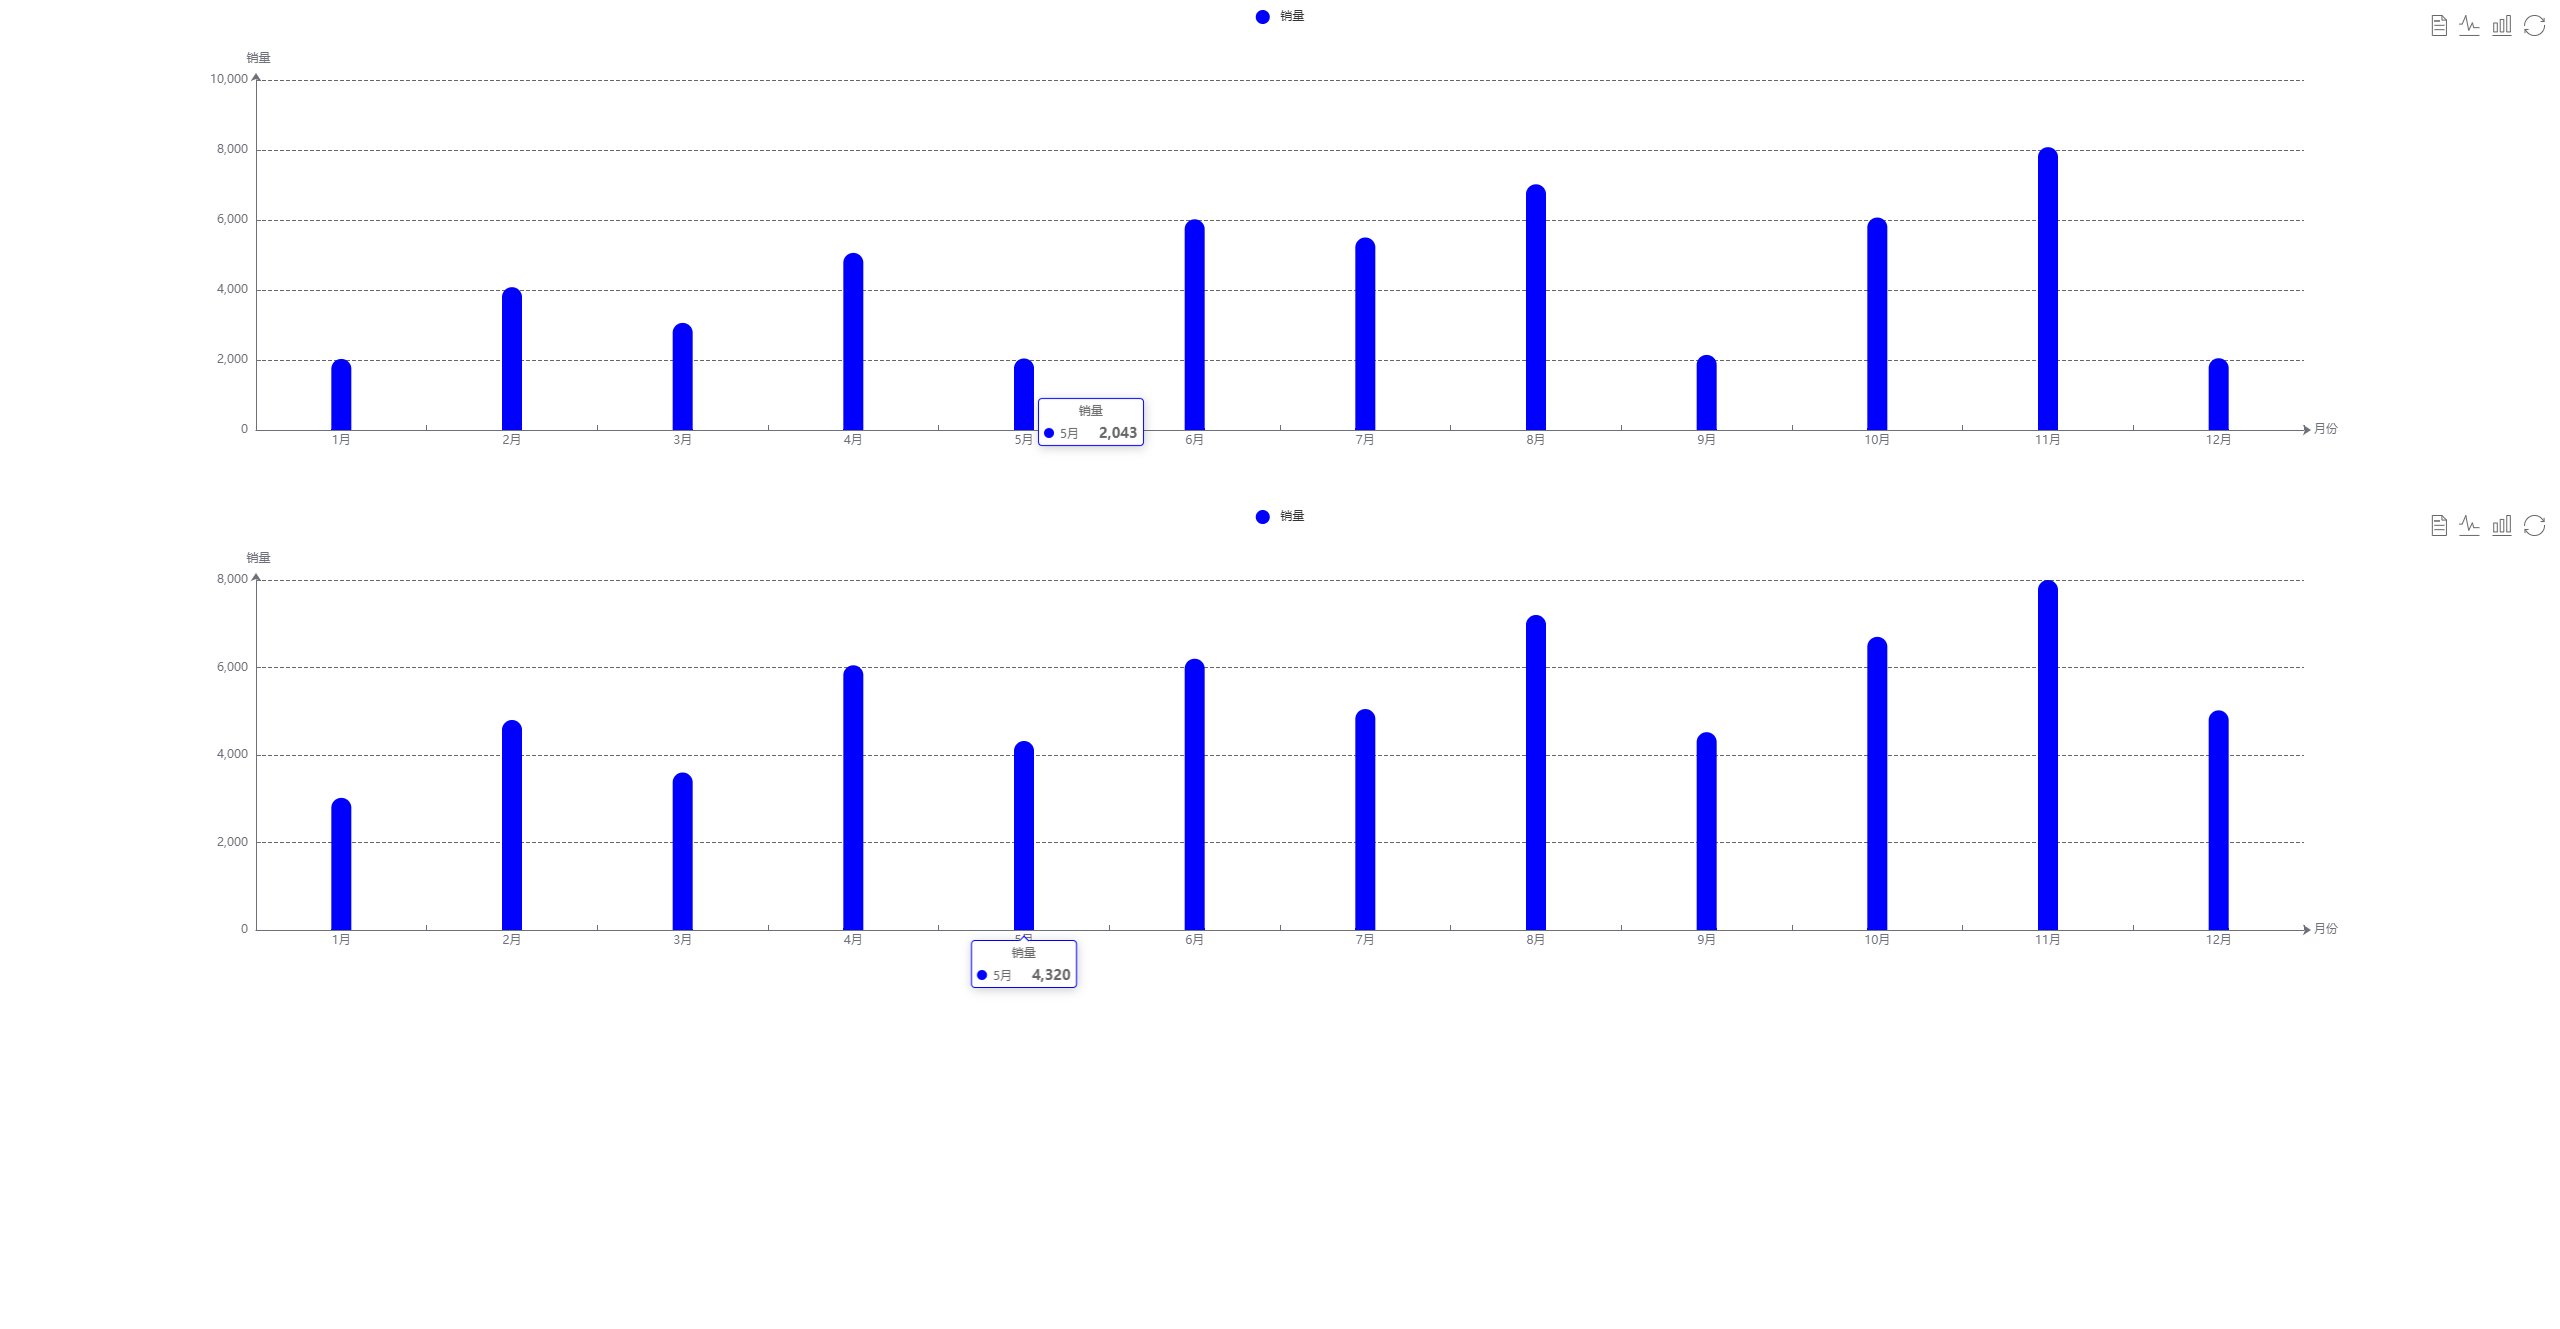
sunnynono opened a new issue, #17047:
URL: https://github.com/apache/echarts/issues/17047
### Version
5.3.2
### Link to Minimal Reproduction
_No response_
### Steps to Reproduce
1. 初始化生成了两个柱状图
2. 柱状图一option:{
legend: {
type:
echarts-bot[bot] commented on issue #17046:
URL: https://github.com/apache/echarts/issues/17046#issuecomment-1128495709
@xinlong-chen865 It seems you are not using English, I've helped translate
the content automatically. To make your issue understood by more people and get
helped, we'd
xinlong-chen865 opened a new issue, #17046:
URL: https://github.com/apache/echarts/issues/17046
### Version
5.22
### Link to Minimal Reproduction
_No response_
### Steps to Reproduce
我通过on('click', params => { xx });
echarts-bot[bot] commented on issue #17045:
URL: https://github.com/apache/echarts/issues/17045#issuecomment-1128493768
@xuych It seems you are not using English, I've helped translate the content
automatically. To make your issue understood by more people and get helped,
we'd like to
xuych opened a new issue, #17045:
URL: https://github.com/apache/echarts/issues/17045
### What problem does this feature solve?
怎么设置series.graph.
symbol的backgroundColor以及自适应宽高,当前文字如果稍微多几个字符就会出来,而且官网没看到怎么改背景颜色
![Uploading image.png…]()
### What does the proposed API look
echarts-bot[bot] commented on PR #17044:
URL: https://github.com/apache/echarts/pull/17044#issuecomment-1128469978
Thanks for your contribution!
The community will review it ASAP. In the meanwhile, please checkout [the
coding standard](https://echarts.apache.org/en/coding-standard.html)
jiawulin001 opened a new pull request, #17044:
URL: https://github.com/apache/echarts/pull/17044
## Brief Information
This pull request is in the type of:
- [ ] bug fixing
- [x] new feature
- [ ] others
### What does this PR do?
Allow user to
51 matches
Mail list logo