[GitHub] [incubator-echarts] 0x018 commented on issue #11623: selectorLabel 是否支持 修改emphasis样式?
0x018 commented on issue #11623: selectorLabel 是否支持 修改emphasis样式?
URL:
https://github.com/apache/incubator-echarts/issues/11623#issuecomment-553268500


   > Is your problem the same as #11480?

   no, different problems.


This is an automated message from the Apache Git Service.
To respond to the message, please log on to GitHub and use the
URL above to go to the specific comment.

For queries about this service, please contact Infrastructure at:
us...@infra.apache.org


With regards,
Apache Git Services

-
To unsubscribe, e-mail: commits-unsubscr...@echarts.apache.org
For additional commands, e-mail: commits-h...@echarts.apache.org
[GitHub] [incubator-echarts] xdlee1 commented on issue #11499: 折线图分段显示颜色出错
xdlee1 commented on issue #11499: 折线图分段显示颜色出错
URL:
https://github.com/apache/incubator-echarts/issues/11499#issuecomment-553268996


   @Ovilia 你好,我是xdlee,是在数据量比较多的情况下,比如3000条以上,折线间点的连线,颜色和设定的不一致。


This is an automated message from the Apache Git Service.
To respond to the message, please log on to GitHub and use the
URL above to go to the specific comment.

For queries about this service, please contact Infrastructure at:
us...@infra.apache.org


With regards,
Apache Git Services

-
To unsubscribe, e-mail: commits-unsubscr...@echarts.apache.org
For additional commands, e-mail: commits-h...@echarts.apache.org
[GitHub] [incubator-echarts] lvybriage commented on issue #5680: 动态更新数据的时候datazoom如何保持固定区间
lvybriage commented on issue #5680: 动态更新数据的时候datazoom如何保持固定区间
URL:
https://github.com/apache/incubator-echarts/issues/5680#issuecomment-552817067


   > @colbertchai 谢谢你的回复,我已经采用其他的方式解决了

   请问是怎么解决的呀,我也遇到了这个问题


This is an automated message from the Apache Git Service.
To respond to the message, please log on to GitHub and use the
URL above to go to the specific comment.

For queries about this service, please contact Infrastructure at:
us...@infra.apache.org


With regards,
Apache Git Services

-
To unsubscribe, e-mail: commits-unsubscr...@echarts.apache.org
For additional commands, e-mail: commits-h...@echarts.apache.org
[GitHub] [incubator-echarts] ccksfh commented on issue #2993: echarts3中graph关系图series[i]-graph.data[i]中的x,y怎么定义,API中没有
ccksfh commented on issue #2993:
echarts3中graph关系图series[i]-graph.data[i]中的x,y怎么定义,API中没有
URL:
https://github.com/apache/incubator-echarts/issues/2993#issuecomment-552806073


   same issue fixed并不会固定位置,节点删减和位置移动都会影响其他节点的位置(感觉有斥力存在),文档上也没描述清楚坐标原点、默认坐标系等信息


This is an automated message from the Apache Git Service.
To respond to the message, please log on to GitHub and use the
URL above to go to the specific comment.

For queries about this service, please contact Infrastructure at:
us...@infra.apache.org


With regards,
Apache Git Services

-
To unsubscribe, e-mail: commits-unsubscr...@echarts.apache.org
For additional commands, e-mail: commits-h...@echarts.apache.org
[GitHub] [incubator-echarts] MINDoSOFT edited a comment on issue #10151: When setOption has dataZoom startValue or endValue, the label of the dataZoom slider does not show
MINDoSOFT edited a comment on issue #10151: When setOption has dataZoom startValue or endValue, the label of the dataZoom slider does not show URL: https://github.com/apache/incubator-echarts/issues/10151#issuecomment-552827397 Hi there ! I have a created a jsfiddle using the code provided by @mbury (updated the echarts library to use 4.4.0 because the bug changed) , https://jsfiddle.net/0kqyjgw9/1/ Please note that this is a bug that occurs on the drag of the zoom slider after chart **setOption** is called. On the first time that you drag the zoom slider you see the labels stuck showing only the start and end of the range. 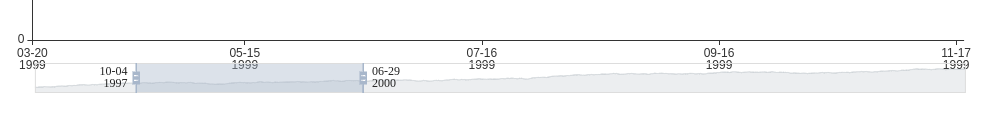 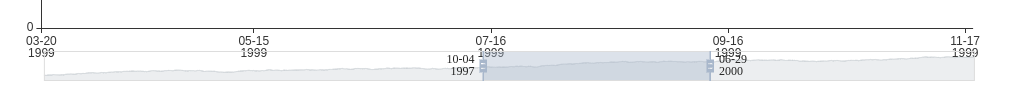 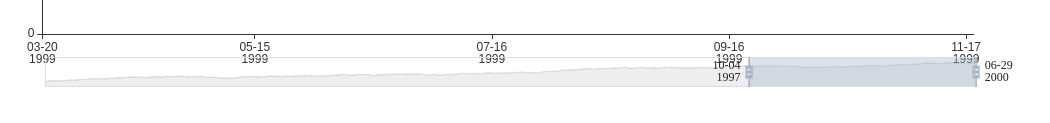 On the second and rest of the times you can see the correct labels (which is the current slider range).  This is a very important thing to be fixed for us. Because we have an ajax callback that sets the chart options and thus every time the labels on the zoom slider are not shown. Thank you for your time, Sergios. This is an automated message from the Apache Git Service. To respond to the message, please log on to GitHub and use the URL above to go to the specific comment. For queries about this service, please contact Infrastructure at: us...@infra.apache.org With regards, Apache Git Services - To unsubscribe, e-mail: commits-unsubscr...@echarts.apache.org For additional commands, e-mail: commits-h...@echarts.apache.org
[GitHub] [incubator-echarts] MINDoSOFT edited a comment on issue #10151: When setOption has dataZoom startValue or endValue, the label of the dataZoom slider does not show
MINDoSOFT edited a comment on issue #10151: When setOption has dataZoom startValue or endValue, the label of the dataZoom slider does not show URL: https://github.com/apache/incubator-echarts/issues/10151#issuecomment-552827397 Hi there ! I have a created a jsfiddle using the code provided by @mbury (updated the echarts library to use 4.4.0 because the bug changed) , https://jsfiddle.net/0kqyjgw9/1/ Please note that this is a bug that occurs on the drag of the zoom slider after chart **setOption** is called. On the first time that you drag the zoom slider you see the labels stuck showing only the start and end of the range. (see the labels of the zoom slider on the next 3 screenshots they are all stuck at 10-04 1997 and 06-29 2000)    On the second and rest of the times you can see the correct labels (which is the current slider range). (see the labels of the zoom slider on the next 3 screenshots that are changing correctly)  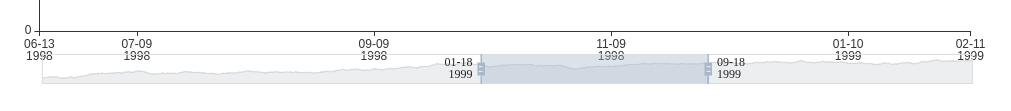  This is a very important thing to be fixed for us. Because we have an ajax callback that sets the chart options and thus every time the labels on the zoom slider are not shown. Thank you for your time, Sergios. This is an automated message from the Apache Git Service. To respond to the message, please log on to GitHub and use the URL above to go to the specific comment. For queries about this service, please contact Infrastructure at: us...@infra.apache.org With regards, Apache Git Services - To unsubscribe, e-mail: commits-unsubscr...@echarts.apache.org For additional commands, e-mail: commits-h...@echarts.apache.org
[GitHub] [incubator-echarts] duuliy commented on issue #9387: lines图画轨迹时,数据更新问题。
duuliy commented on issue #9387: lines图画轨迹时,数据更新问题。
URL:
https://github.com/apache/incubator-echarts/issues/9387#issuecomment-552866819


   需要跟你一样的效果,就算用appendData 只只能增加点,不能增加彗星的线,而且一样的有闪烁效果。。请问你或者是用其他的可视化方案解决的吗?
@chaserstrong


This is an automated message from the Apache Git Service.
To respond to the message, please log on to GitHub and use the
URL above to go to the specific comment.

For queries about this service, please contact Infrastructure at:
us...@infra.apache.org


With regards,
Apache Git Services

-
To unsubscribe, e-mail: commits-unsubscr...@echarts.apache.org
For additional commands, e-mail: commits-h...@echarts.apache.org
[GitHub] [incubator-echarts] mglimmerveen commented on issue #11589: Is it possible to put the y-axis both left and right?
mglimmerveen commented on issue #11589: Is it possible to put the y-axis both
left and right?
URL:
https://github.com/apache/incubator-echarts/issues/11589#issuecomment-552803943


   As I pointed out in the first post, I did try duplicating the entire series.
So, yeah, that would certainly work. And I guess it might be doable in case of
a small chart, but does have a negative performance impact on rendering larger
data sets.

   I would personally argue that this is a suboptimal solution/workaround.


This is an automated message from the Apache Git Service.
To respond to the message, please log on to GitHub and use the
URL above to go to the specific comment.

For queries about this service, please contact Infrastructure at:
us...@infra.apache.org


With regards,
Apache Git Services

-
To unsubscribe, e-mail: commits-unsubscr...@echarts.apache.org
For additional commands, e-mail: commits-h...@echarts.apache.org
[GitHub] [incubator-echarts] MINDoSOFT commented on issue #10151: When setOption has dataZoom startValue or endValue, the label of the dataZoom slider does not show
MINDoSOFT commented on issue #10151: When setOption has dataZoom startValue or endValue, the label of the dataZoom slider does not show URL: https://github.com/apache/incubator-echarts/issues/10151#issuecomment-552827397 Hi there ! I have a created a jsfiddle using the code provided by @mbury , https://jsfiddle.net/5ab0hoce/1/ Please note that this is a bug that occurs on the drag of the zoom slider after chart **setOption** is called. On the first time that you drag the zoom slider you see nothing (on the labels showing the start and the end of the zoom slider).  On the second and rest of the times you can see the labels.  This is a very important thing to be fixed for us. Because we have an ajax callback that sets the chart options and thus every time the labels on the zoom slider are not shown. Thank you for your time, Sergios. This is an automated message from the Apache Git Service. To respond to the message, please log on to GitHub and use the URL above to go to the specific comment. For queries about this service, please contact Infrastructure at: us...@infra.apache.org With regards, Apache Git Services - To unsubscribe, e-mail: commits-unsubscr...@echarts.apache.org For additional commands, e-mail: commits-h...@echarts.apache.org
[incubator-echarts] branch fix-11381 created (now 96d88a8)
This is an automated email from the ASF dual-hosted git repository.

ovilia pushed a change to branch fix-11381
in repository https://gitbox.apache.org/repos/asf/incubator-echarts.git.


  at 96d88a8  WIP(pie): support align to edge and labelLine mode

This branch includes the following new commits:

 new 96d88a8  WIP(pie): support align to edge and labelLine mode

The 1 revisions listed above as "new" are entirely new to this
repository and will be described in separate emails.  The revisions
listed as "add" were already present in the repository and have only
been added to this reference.


-
To unsubscribe, e-mail: commits-unsubscr...@echarts.apache.org
For additional commands, e-mail: commits-h...@echarts.apache.org
[incubator-echarts] 01/01: WIP(pie): support align to edge and labelLine mode
This is an automated email from the ASF dual-hosted git repository.

ovilia pushed a commit to branch fix-11381
in repository https://gitbox.apache.org/repos/asf/incubator-echarts.git

commit 96d88a890ce21d90fb00a5572bfd7b47db055bd1
Author: Ovilia
AuthorDate: Tue Nov 12 19:07:08 2019 +0800

WIP(pie): support align to edge and labelLine mode
---
 src/chart/pie/PieSeries.js   |  10 +++-
 src/chart/pie/PieView.js |   2 +-
 src/chart/pie/labelLayout.js | 138 +--
 3 files changed, 130 insertions(+), 20 deletions(-)

diff --git a/src/chart/pie/PieSeries.js b/src/chart/pie/PieSeries.js
index 42a44e6..c8d8506 100644
--- a/src/chart/pie/PieSeries.js
+++ b/src/chart/pie/PieSeries.js
@@ -147,7 +147,13 @@ var PieSeries = echarts.extendSeriesModel({
 rotate: false,
 show: true,
 // 'outer', 'inside', 'center'
-position: 'outer'
+position: 'outer',
+// 'none', 'labelLine', 'edge'. Works only when position is 'outer'
+alignTo: 'none',
+// Closest distance between label and chart edge.
+// Works only position is 'outer' and alignTo is 'labelLine' or
'edge'.
+edgeMargin: 50,
+padding: 5,
 // formatter: 标签文本格式器,同Tooltip.formatter,不支持异步回调
 // 默认使用全局文本样式,详见TEXTSTYLE
 // distance: 当position为inner时有效,为label位置到圆心的距离与圆半径(环状图为内外半径和)的比例系数
@@ -159,6 +165,8 @@ var PieSeries = echarts.extendSeriesModel({
 length: 15,
 // 引导线两段中的第二段长度
 length2: 15,
+maxLength2: 100,
+minLength2: 15,
 smooth: false,
 lineStyle: {
 // color: 各异,
diff --git a/src/chart/pie/PieView.js b/src/chart/pie/PieView.js
index 69e6903..7d17246 100644
--- a/src/chart/pie/PieView.js
+++ b/src/chart/pie/PieView.js
@@ -273,7 +273,7 @@ piePieceProto._updateLabel = function (data, idx,
withAnimation) {
 {
 labelFetcher: data.hostModel,
 labelDataIndex: idx,
-defaultText: data.getName(idx),
+defaultText: labelLayout.truncatedText,
 autoColor: visualColor,
 useInsideStyle: !!labelLayout.inside
 },
diff --git a/src/chart/pie/labelLayout.js b/src/chart/pie/labelLayout.js
index f2492fe..d31f58a 100644
--- a/src/chart/pie/labelLayout.js
+++ b/src/chart/pie/labelLayout.js
@@ -20,10 +20,11 @@
 // FIXME emphasis label position is not same with normal label position

 import * as textContain from 'zrender/src/contain/text';
+import {parsePercent} from '../../util/number';

 var RADIAN = Math.PI / 180;

-function adjustSingleSide(list, cx, cy, r, dir, viewWidth, viewHeight) {
+function adjustSingleSide(list, cx, cy, r, dir, viewWidth, viewHeight,
labelLine) {
 list.sort(function (a, b) {
 return a.y - b.y;
 });
@@ -54,7 +55,7 @@ function adjustSingleSide(list, cx, cy, r, dir, viewWidth,
viewHeight) {
 }
 }

-function changeX(list, isDownList, cx, cy, r, dir) {
+function changeX(list, isDownList, cx, cy, r, dir, maxTextWidth) {
 var lastDeltaX = dir > 0
 ? isDownList// right-side
 ? Number.MAX_VALUE  // down
@@ -64,6 +65,35 @@ function adjustSingleSide(list, cx, cy, r, dir, viewWidth,
viewHeight) {
 : 0;// up

 for (var i = 0, l = list.length; i < l; i++) {
+if (list[i].labelAlignTo !== 'none') {
+var dx = labelLine.dx * dir;
+var x2 = list[i].linePoints[1][0];
+var x3 = list[i].linePoints[2][0] + dx;
+var len2 = (x3 - x2) * dir;
+
+list[i].x = x3 + dir * list[i].labelPadding;
+if (len2 < labelLine.restrainMinLen2) {
+var x3Updated = x2 + labelLine.restrainMinLen2 * dir;
+var padding = list[i].labelPadding;
+
+var textWidth = list[i].width + (x3 - x3Updated + padding)
* dir;
+list[i].truncatedText = textContain.truncateText(
+list[i].truncatedText,
+textWidth,
+list[i].font
+);
+var realTextWidth = textContain.getWidth(
+list[i].truncatedText,
+list[i].font
+);
+list[i].x += dir * (list[i].width - realTextWidth);
+
+x3 = x3Updated;
+}
+list[i].linePoints[2][0] = x3;
+continue;
+}
+
 var deltaY = Math.abs(list[i].y - cy);
 var length = list[i].len;
 var length2 = list[i].len2;
@@ -92,12 +122,14 @@ function adjustSingleSide(list, cx, cy, r, dir, viewWidth,
viewHeight) {
 var len = list.length;
 var upList = [];
 var downList = [];
+
[GitHub] [incubator-echarts] Ovilia opened a new pull request #11632: WIP(pie): support align to edge and labelLine mode
Ovilia opened a new pull request #11632: WIP(pie): support align to edge and
labelLine mode
URL: https://github.com/apache/incubator-echarts/pull/11632


   WIP.
   Still needs further tests for boundary situations.


This is an automated message from the Apache Git Service.
To respond to the message, please log on to GitHub and use the
URL above to go to the specific comment.

For queries about this service, please contact Infrastructure at:
us...@infra.apache.org


With regards,
Apache Git Services

-
To unsubscribe, e-mail: commits-unsubscr...@echarts.apache.org
For additional commands, e-mail: commits-h...@echarts.apache.org
[GitHub] [incubator-echarts] MINDoSOFT edited a comment on issue #10151: When setOption has dataZoom startValue or endValue, the label of the dataZoom slider does not show
MINDoSOFT edited a comment on issue #10151: When setOption has dataZoom startValue or endValue, the label of the dataZoom slider does not show URL: https://github.com/apache/incubator-echarts/issues/10151#issuecomment-552827397 Hi there ! I have a created a jsfiddle using the code provided by @mbury (updated the echarts library to use 4.4.0 because the bug changed) , https://jsfiddle.net/0kqyjgw9/1/ Please note that this is a bug that occurs on the drag of the zoom slider after chart **setOption** is called. On the first time that you drag the zoom slider you see the labels stuck showing only the start and end of the range. (see the values on the next 3 screenshots they are all 10-04 1997 and 06-29 2000)    On the second and rest of the times you can see the correct labels (which is the current slider range). (see the values on the next 3 screenshots that are changing)    This is a very important thing to be fixed for us. Because we have an ajax callback that sets the chart options and thus every time the labels on the zoom slider are not shown. Thank you for your time, Sergios. This is an automated message from the Apache Git Service. To respond to the message, please log on to GitHub and use the URL above to go to the specific comment. For queries about this service, please contact Infrastructure at: us...@infra.apache.org With regards, Apache Git Services - To unsubscribe, e-mail: commits-unsubscr...@echarts.apache.org For additional commands, e-mail: commits-h...@echarts.apache.org
[GitHub] [incubator-echarts] sjcobb commented on issue #10172: Axis name padding does not account for axis labels
sjcobb commented on issue #10172: Axis name padding does not account for axis labels URL: https://github.com/apache/incubator-echarts/issues/10172#issuecomment-553067453 I agree this feature would be very useful. I've tried using grid.containLabel along with various other properties mentioned above, but it leads to a lot of manual calculations to account for the overlap and I can't always predict the data range a particular chart will need to display. Here is an example where the axis label notation (thousands, millions, trillions, etc.) and format can be customized by dashboard users, which means axisLabels have a wide range of potential widths: 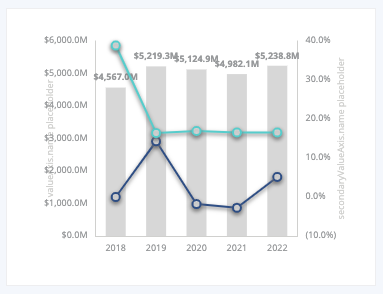 This is an automated message from the Apache Git Service. To respond to the message, please log on to GitHub and use the URL above to go to the specific comment. For queries about this service, please contact Infrastructure at: us...@infra.apache.org With regards, Apache Git Services - To unsubscribe, e-mail: commits-unsubscr...@echarts.apache.org For additional commands, e-mail: commits-h...@echarts.apache.org
[GitHub] [incubator-echarts] foolzhang commented on a change in pull request #11557: feat(polar) about ISSUE 11452
foolzhang commented on a change in pull request #11557: feat(polar) about ISSUE
11452
URL:
https://github.com/apache/incubator-echarts/pull/11557#discussion_r345106212


 ##
 File path: src/chart/bar/BarView.js
 ##
 @@ -424,8 +425,9 @@ function updateStyle(

 el.useStyle(zrUtil.defaults(
 {
-fill: layout.startAngle === layout.endAngle ? 'transparent' :
color,
-opacity: layout.startAngle === layout.endAngle ? 0 : opacity
+stroke : layout.startAngle === layout.endAngle ? 'none' : stroke,
+fill: layout.startAngle === layout.endAngle ? 'none' : color,
+opacity: opacity

 Review comment:
   sorry about not consider `emphasis` and last week I'm confused by what you
say about "silent".  lastweek i have tryed this
   ```javascript
   if(layout.startAngle != layout.endAngle){
   graphic.setHoverStyle(el, hoverStyle);
   }
   it seems ok


This is an automated message from the Apache Git Service.
To respond to the message, please log on to GitHub and use the
URL above to go to the specific comment.

For queries about this service, please contact Infrastructure at:
us...@infra.apache.org


With regards,
Apache Git Services

-
To unsubscribe, e-mail: commits-unsubscr...@echarts.apache.org
For additional commands, e-mail: commits-h...@echarts.apache.org
[GitHub] [incubator-echarts] hcen1997 commented on issue #4678: 关于折线图y轴刻度自定义的问题
hcen1997 commented on issue #4678: 关于折线图y轴刻度自定义的问题
URL:
https://github.com/apache/incubator-echarts/issues/4678#issuecomment-552908575


   可以使用markline模仿
   源地址:http://www.tdon.site/post/26


This is an automated message from the Apache Git Service.
To respond to the message, please log on to GitHub and use the
URL above to go to the specific comment.

For queries about this service, please contact Infrastructure at:
us...@infra.apache.org


With regards,
Apache Git Services

-
To unsubscribe, e-mail: commits-unsubscr...@echarts.apache.org
For additional commands, e-mail: commits-h...@echarts.apache.org
[GitHub] [incubator-echarts] susiwen8 commented on issue #11617: Add new methods for List and fix #11616
susiwen8 commented on issue #11617: Add new methods for List and fix #11616
URL:
https://github.com/apache/incubator-echarts/pull/11617#issuecomment-552937018


   @pissang I think `numCalculate` has no logical problem, only the parameter.
When the chart is stacked, it returns max or min of the stacked data, and then
using `indicesOfNearest` to get data index. So just set dimension to target
dimension will fix this.


This is an automated message from the Apache Git Service.
To respond to the message, please log on to GitHub and use the
URL above to go to the specific comment.

For queries about this service, please contact Infrastructure at:
us...@infra.apache.org


With regards,
Apache Git Services

-
To unsubscribe, e-mail: commits-unsubscr...@echarts.apache.org
For additional commands, e-mail: commits-h...@echarts.apache.org
[GitHub] [incubator-echarts] YancyLee commented on issue #7878: 我访问Echarts官网出现403错误
YancyLee commented on issue #7878: 我访问Echarts官网出现403错误
URL:
https://github.com/apache/incubator-echarts/issues/7878#issuecomment-552963832


   我也遇到了这个问题,一样是macOS系统,但是朋友的windows好像没这个问题


This is an automated message from the Apache Git Service.
To respond to the message, please log on to GitHub and use the
URL above to go to the specific comment.

For queries about this service, please contact Infrastructure at:
us...@infra.apache.org


With regards,
Apache Git Services

-
To unsubscribe, e-mail: commits-unsubscr...@echarts.apache.org
For additional commands, e-mail: commits-h...@echarts.apache.org
[incubator-echarts-doc] branch doc-revise updated (dcd34c4 -> 38b93c8)
This is an automated email from the ASF dual-hosted git repository.

wangdd pushed a change to branch doc-revise
in repository https://gitbox.apache.org/repos/asf/incubator-echarts-doc.git.


from dcd34c4  @Wdingding fix: option/x-axis、y-axis、axis-commo of doc
 add 38b93c8  fix: Modify the style of [Example], [Optional], and [Note] in
the document.

No new revisions were added by this update.

Summary of changes:
 zh/option/component/aria.md  |   4 +-
 zh/option/component/axisPointer.md   |   4 +-
 zh/option/component/brush.md |   8 +-
 zh/option/component/data-zoom-inside.md  |  18 ++--
 zh/option/component/data-zoom.md |  16 ++--
 zh/option/component/dataset.md   |   6 +-
 zh/option/component/geo.md   |   6 +-
 zh/option/component/graphic.md   |   8 +-
 zh/option/component/parallel.md  |   4 +-
 zh/option/component/polar.md |   2 +-
 zh/option/component/radar.md |   9 +-
 zh/option/component/timeline.md  | 122 +--
 zh/option/component/title.md |   2 +-
 zh/option/component/toolbox.md   |  36
 zh/option/component/visual-map-continuous.md |  17 ++--
 zh/option/component/visual-map-piecewise.md  |  40 +
 zh/option/component/visual-map.md|  14 +--
 zh/option/component/x-axis.md|   2 +-
 zh/option/option.md  |   2 +-
 zh/option/partial/1d-data.md |   2 +-
 zh/option/partial/2d-data.md |   6 +-
 zh/option/partial/animation.md   |   4 +-
 zh/option/partial/area-style.md  |   4 +-
 zh/option/partial/axisPointer-common.md  |  13 +--
 zh/option/partial/barGrid.md |   2 +-
 zh/option/partial/component-common-style.md  |  11 +--
 zh/option/partial/encode-dimensions.md   |   8 +-
 zh/option/partial/label.md   |  12 +--
 zh/option/partial/line-data.md   |   2 +-
 zh/option/partial/line-style.md  |   2 +-
 zh/option/partial/mark-line.md   |   8 +-
 zh/option/partial/mark-point.md  |   2 +-
 zh/option/partial/marker.md  |   2 +-
 zh/option/partial/padding.md |   4 +-
 zh/option/partial/parallel.md|   8 +-
 zh/option/partial/progressive.md |   8 +-
 zh/option/partial/style-shadow-opacity.md|  23 +++--
 zh/option/partial/symbol.md  |   8 +-
 zh/option/partial/text-style.md  |  45 +-
 zh/option/partial/tooltip-common.md  |  64 +-
 zh/option/partial/zr-graphic.md  |  36
 zh/option/series/boxplot.md  |   6 +-
 zh/option/series/candlestick.md  |   6 +-
 zh/option/series/custom.md   |  14 +--
 zh/option/series/funnel.md   |   2 +-
 zh/option/series/gauge.md|   5 +-
 zh/option/series/graph.md|  21 +++--
 zh/option/series/heatmap.md  |   2 +-
 zh/option/series/line.md |  13 +--
 zh/option/series/lines.md|  10 ++-
 zh/option/series/pictorialBar.md |  32 +++
 zh/option/series/sankey.md   |  23 +++--
 zh/option/series/sunburst.md |  17 ++--
 zh/option/series/themeRiver.md   |   4 +-
 zh/option/series/tree.md |  12 ++-
 zh/option/series/treemap.md  |  26 +++---
 56 files changed, 419 insertions(+), 368 deletions(-)


-
To unsubscribe, e-mail: commits-unsubscr...@echarts.apache.org
For additional commands, e-mail: commits-h...@echarts.apache.org
[GitHub] [incubator-echarts] zhangmengyi opened a new issue #11631: 柱状图在对数轴中不显示
zhangmengyi opened a new issue #11631: 柱状图在对数轴中不显示
URL: https://github.com/apache/incubator-echarts/issues/11631


   https://gallery.echartsjs.com/editor.html?c=x8NbZa59DF=1

   柱状图不显示是为什么呀?


This is an automated message from the Apache Git Service.
To respond to the message, please log on to GitHub and use the
URL above to go to the specific comment.

For queries about this service, please contact Infrastructure at:
us...@infra.apache.org


With regards,
Apache Git Services

-
To unsubscribe, e-mail: commits-unsubscr...@echarts.apache.org
For additional commands, e-mail: commits-h...@echarts.apache.org
[GitHub] [incubator-echarts] echarts-bot[bot] closed issue #11631: 柱状图在对数轴中不显示
echarts-bot[bot] closed issue #11631: 柱状图在对数轴中不显示
URL: https://github.com/apache/incubator-echarts/issues/11631


This is an automated message from the Apache Git Service.
To respond to the message, please log on to GitHub and use the
URL above to go to the specific comment.

For queries about this service, please contact Infrastructure at:
us...@infra.apache.org


With regards,
Apache Git Services

-
To unsubscribe, e-mail: commits-unsubscr...@echarts.apache.org
For additional commands, e-mail: commits-h...@echarts.apache.org
[GitHub] [incubator-echarts] echarts-bot[bot] commented on issue #11631: 柱状图在对数轴中不显示
echarts-bot[bot] commented on issue #11631: 柱状图在对数轴中不显示 URL: https://github.com/apache/incubator-echarts/issues/11631#issuecomment-552783206 This issue is not created using [issue template](https://ecomfe.github.io/echarts-issue-helper/) so I'm going to close it. Sorry for this, but it helps save our maintainers' time so that more developers get helped. Feel free to create another issue using the issue template. If you think you have already made your point clear without the template, or your problem cannot be covered by it, you may re-open this issue again. 这个 issue 未使用 [issue 模板](https://ecomfe.github.io/echarts-issue-helper/?lang=zh-cn) 创建,所以我将关闭此 issue。 为此带来的麻烦我深表歉意,但是请理解这是为了节约社区维护者的时间,以更高效地服务社区的开发者群体。 如果您愿意,可以请使用 issue 模板重新创建 issue。 如果你认为虽然没有使用模板,但你已经提供了复现问题的充分描述,或者你的问题无法使用模板表达,也可以重新 open 这个 issue。 This is an automated message from the Apache Git Service. To respond to the message, please log on to GitHub and use the URL above to go to the specific comment. For queries about this service, please contact Infrastructure at: us...@infra.apache.org With regards, Apache Git Services - To unsubscribe, e-mail: commits-unsubscr...@echarts.apache.org For additional commands, e-mail: commits-h...@echarts.apache.org
[GitHub] [incubator-echarts] szkissyh closed issue #11615: IOS 一个页面切换地理坐标图时报错:TypeError:null is not an object(evaluating 'this.ctx.dpr=this.dpr')
szkissyh closed issue #11615: IOS 一个页面切换地理坐标图时报错:TypeError:null is not an
object(evaluating 'this.ctx.dpr=this.dpr')
URL: https://github.com/apache/incubator-echarts/issues/11615


This is an automated message from the Apache Git Service.
To respond to the message, please log on to GitHub and use the
URL above to go to the specific comment.

For queries about this service, please contact Infrastructure at:
us...@infra.apache.org


With regards,
Apache Git Services

-
To unsubscribe, e-mail: commits-unsubscr...@echarts.apache.org
For additional commands, e-mail: commits-h...@echarts.apache.org
[GitHub] [incubator-echarts] szkissyh commented on issue #11615: IOS 一个页面切换地理坐标图时报错:TypeError:null is not an object(evaluating 'this.ctx.dpr=this.dpr')
szkissyh commented on issue #11615: IOS 一个页面切换地理坐标图时报错:TypeError:null is not an
object(evaluating 'this.ctx.dpr=this.dpr')
URL:
https://github.com/apache/incubator-echarts/issues/11615#issuecomment-552783800


   > 从截图来看你竖屏时候的分辨率太高了,对于 canvas 来说内存占用跟分辨率是正比的

   是分辨率太高了,调整以后就好了,谢谢


This is an automated message from the Apache Git Service.
To respond to the message, please log on to GitHub and use the
URL above to go to the specific comment.

For queries about this service, please contact Infrastructure at:
us...@infra.apache.org


With regards,
Apache Git Services

-
To unsubscribe, e-mail: commits-unsubscr...@echarts.apache.org
For additional commands, e-mail: commits-h...@echarts.apache.org
[GitHub] [incubator-echarts] angwangiot commented on issue #5680: 动态更新数据的时候datazoom如何保持固定区间
angwangiot commented on issue #5680: 动态更新数据的时候datazoom如何保持固定区间 URL: https://github.com/apache/incubator-echarts/issues/5680#issuecomment-553178302 > > > > @colbertchai 谢谢你的回复,我已经采用其他的方式解决了 > > 请问是怎么解决的呀,我也遇到了这个问题 我分等级查询了,并没有按照原来的思路。每次查询时只有一个等级,滚轮滑动也只是显示当前查询的数据。  This is an automated message from the Apache Git Service. To respond to the message, please log on to GitHub and use the URL above to go to the specific comment. For queries about this service, please contact Infrastructure at: us...@infra.apache.org With regards, Apache Git Services - To unsubscribe, e-mail: commits-unsubscr...@echarts.apache.org For additional commands, e-mail: commits-h...@echarts.apache.org
[GitHub] [incubator-echarts] yanmushi commented on issue #11633: when updating the series data on zooming the line chart, the line will be wrong
yanmushi commented on issue #11633: when updating the series data on zooming
the line chart, the line will be wrong
URL:
https://github.com/apache/incubator-echarts/issues/11633#issuecomment-553207639


   this is my code which used on
'https://www.echartsjs.com/examples/zh/editor.html'

[mycode.js.zip](https://github.com/apache/incubator-echarts/files/3839139/mycode.js.zip)


This is an automated message from the Apache Git Service.
To respond to the message, please log on to GitHub and use the
URL above to go to the specific comment.

For queries about this service, please contact Infrastructure at:
us...@infra.apache.org


With regards,
Apache Git Services

-
To unsubscribe, e-mail: commits-unsubscr...@echarts.apache.org
For additional commands, e-mail: commits-h...@echarts.apache.org
[GitHub] [incubator-echarts] yanmushi opened a new issue #11634: when clear the chart and reset by setOpiton, the toolbox feature datazoom.back will be unusable
yanmushi opened a new issue #11634: when clear the chart and reset by
setOpiton, the toolbox feature datazoom.back will be unusable
URL: https://github.com/apache/incubator-echarts/issues/11634


   ### Version
   4.4.0

   ### Steps to reproduce
   step 1: add datazoom event listener
   step 2: when the event is triggered, i clear the echart and reset it by
function setOption
   step 3: click the back button, it will be unusable

   ### What is expected?
   trigger the event listener

   ### What is actually happening?
   no trigger the event listener

   ---
   linked: https://github.com/apache/incubator-echarts/issues/11633
   i want group filter the series data when the array has more than 1M points,
and when zoom the chart, use the no filtered data.


This is an automated message from the Apache Git Service.
To respond to the message, please log on to GitHub and use the
URL above to go to the specific comment.

For queries about this service, please contact Infrastructure at:
us...@infra.apache.org


With regards,
Apache Git Services

-
To unsubscribe, e-mail: commits-unsubscr...@echarts.apache.org
For additional commands, e-mail: commits-h...@echarts.apache.org
[GitHub] [incubator-echarts] xdlee commented on issue #11499: 折线图分段显示颜色出错
xdlee commented on issue #11499: 折线图分段显示颜色出错
URL:
https://github.com/apache/incubator-echarts/issues/11499#issuecomment-553211588


   抱歉,我现在无法登录gmail,pc没有办法获取到验证码进行登录


This is an automated message from the Apache Git Service.
To respond to the message, please log on to GitHub and use the
URL above to go to the specific comment.

For queries about this service, please contact Infrastructure at:
us...@infra.apache.org


With regards,
Apache Git Services

-
To unsubscribe, e-mail: commits-unsubscr...@echarts.apache.org
For additional commands, e-mail: commits-h...@echarts.apache.org
[GitHub] [incubator-echarts] zylGitzyl opened a new issue #11635: gauge tooltip , issue
zylGitzyl opened a new issue #11635: gauge tooltip ,issue
URL: https://github.com/apache/incubator-echarts/issues/11635


   why not mouseover show tooltip?


This is an automated message from the Apache Git Service.
To respond to the message, please log on to GitHub and use the
URL above to go to the specific comment.

For queries about this service, please contact Infrastructure at:
us...@infra.apache.org


With regards,
Apache Git Services

-
To unsubscribe, e-mail: commits-unsubscr...@echarts.apache.org
For additional commands, e-mail: commits-h...@echarts.apache.org
[GitHub] [incubator-echarts] echarts-bot[bot] commented on issue #11635: gauge tooltip , issue
echarts-bot[bot] commented on issue #11635: gauge tooltip ,issue URL: https://github.com/apache/incubator-echarts/issues/11635#issuecomment-553219713 This issue is not created using [issue template](https://ecomfe.github.io/echarts-issue-helper/) so I'm going to close it. Sorry for this, but it helps save our maintainers' time so that more developers get helped. Feel free to create another issue using the issue template. If you think you have already made your point clear without the template, or your problem cannot be covered by it, you may re-open this issue again. 这个 issue 未使用 [issue 模板](https://ecomfe.github.io/echarts-issue-helper/?lang=zh-cn) 创建,所以我将关闭此 issue。 为此带来的麻烦我深表歉意,但是请理解这是为了节约社区维护者的时间,以更高效地服务社区的开发者群体。 如果您愿意,可以请使用 issue 模板重新创建 issue。 如果你认为虽然没有使用模板,但你已经提供了复现问题的充分描述,或者你的问题无法使用模板表达,也可以重新 open 这个 issue。 This is an automated message from the Apache Git Service. To respond to the message, please log on to GitHub and use the URL above to go to the specific comment. For queries about this service, please contact Infrastructure at: us...@infra.apache.org With regards, Apache Git Services - To unsubscribe, e-mail: commits-unsubscr...@echarts.apache.org For additional commands, e-mail: commits-h...@echarts.apache.org
[GitHub] [incubator-echarts] echarts-bot[bot] closed issue #11635: gauge tooltip , issue
echarts-bot[bot] closed issue #11635: gauge tooltip ,issue
URL: https://github.com/apache/incubator-echarts/issues/11635


This is an automated message from the Apache Git Service.
To respond to the message, please log on to GitHub and use the
URL above to go to the specific comment.

For queries about this service, please contact Infrastructure at:
us...@infra.apache.org


With regards,
Apache Git Services

-
To unsubscribe, e-mail: commits-unsubscr...@echarts.apache.org
For additional commands, e-mail: commits-h...@echarts.apache.org
[GitHub] [incubator-echarts] xdlee1 commented on issue #11499: 折线图分段显示颜色出错
xdlee1 commented on issue #11499: 折线图分段显示颜色出错
URL:
https://github.com/apache/incubator-echarts/issues/11499#issuecomment-553258319


   test


This is an automated message from the Apache Git Service.
To respond to the message, please log on to GitHub and use the
URL above to go to the specific comment.

For queries about this service, please contact Infrastructure at:
us...@infra.apache.org


With regards,
Apache Git Services

-
To unsubscribe, e-mail: commits-unsubscr...@echarts.apache.org
For additional commands, e-mail: commits-h...@echarts.apache.org
[GitHub] [incubator-echarts] yanmushi opened a new issue #11633: when updating the series data on zooming the line chart, the line will be wrong
yanmushi opened a new issue #11633: when updating the series data on zooming
the line chart, the line will be wrong
URL: https://github.com/apache/incubator-echarts/issues/11633


   ### Version
   4.4.0

   ### Steps to reproduce
   step 1. prepare two series array A and B, the A array has 100 points, and
the B array has 1 points. A is a part of B.
   step 2. use the A array to init the echarts, and enable the toolbox, and add
the datazoom event listener
   step 3. when trigger the datazoom event, we will use the B array which
filter by start and end value to update the chart
   step 4. repeat 3, it will happen.

   ### What is expected?
   use the new data to render the data

   ### What is actually happening?
   the line chart have the circle

   ---
   i want to render the series data which has 600k points, and the echarts will
be slow. Then I filter some points by grouping, and I want to use the part
point to render the line, when user zoom the chart.


This is an automated message from the Apache Git Service.
To respond to the message, please log on to GitHub and use the
URL above to go to the specific comment.

For queries about this service, please contact Infrastructure at:
us...@infra.apache.org


With regards,
Apache Git Services

-
To unsubscribe, e-mail: commits-unsubscr...@echarts.apache.org
For additional commands, e-mail: commits-h...@echarts.apache.org
[GitHub] [incubator-echarts] echarts-bot[bot] commented on issue #11633: when updating the series data on zooming the line chart, the line will be wrong
echarts-bot[bot] commented on issue #11633: when updating the series data on zooming the line chart, the line will be wrong URL: https://github.com/apache/incubator-echarts/issues/11633#issuecomment-553205019 Hi! We've received your issue and please be patient to get responded. The average response time is expected to be within one day for weekdays. In the meanwhile, please make sure that **you have posted enough image to demo your request**. You may also check out the [API](http://echarts.apache.org/api.html) and [chart option](http://echarts.apache.org/option.html) to get the answer. If you don't get helped for a long time (over a week) or have an urgent question to ask, you may also send an email to d...@echarts.apache.org. Please attach the issue link if it's a technical questions. If you are interested in the project, you may also subscribe our [mail list](https://echarts.apache.org/en/maillist.html). Have a nice day! This is an automated message from the Apache Git Service. To respond to the message, please log on to GitHub and use the URL above to go to the specific comment. For queries about this service, please contact Infrastructure at: us...@infra.apache.org With regards, Apache Git Services - To unsubscribe, e-mail: commits-unsubscr...@echarts.apache.org For additional commands, e-mail: commits-h...@echarts.apache.org
[GitHub] [incubator-echarts] yanmushi commented on issue #11633: when updating the series data on zooming the line chart, the line will be wrong
yanmushi commented on issue #11633: when updating the series data on zooming the line chart, the line will be wrong URL: https://github.com/apache/incubator-echarts/issues/11633#issuecomment-553206185   This is an automated message from the Apache Git Service. To respond to the message, please log on to GitHub and use the URL above to go to the specific comment. For queries about this service, please contact Infrastructure at: us...@infra.apache.org With regards, Apache Git Services - To unsubscribe, e-mail: commits-unsubscr...@echarts.apache.org For additional commands, e-mail: commits-h...@echarts.apache.org