Ovilia commented on issue #18172:
URL: https://github.com/apache/echarts/issues/18172#issuecomment-1383576836
I would say this is not a good way to visualize the 2d data. Using radius
for one dimension and angle for another dimension for a pie series is not
obvious for the user to
Kanglt commented on issue #18176:
URL: https://github.com/apache/echarts/issues/18176#issuecomment-1383438644
fromDatasetIndex层级错了,打扰
--
This is an automated message from the Apache Git Service.
To respond to the message, please log on to GitHub and use the
URL above to go to the specific
Kanglt closed issue #18176: [Bug]
dataset.transform并指定fromDatasetIndex无效,始终指向第一个dataset
URL: https://github.com/apache/echarts/issues/18176
--
This is an automated message from the Apache Git Service.
To respond to the message, please log on to GitHub and use the
URL above to go to the
echarts-bot[bot] commented on issue #18176:
URL: https://github.com/apache/echarts/issues/18176#issuecomment-1383375401
@Kanglt It seems you are not using English, I've helped translate the
content automatically. To make your issue understood by more people and get
helped, we'd like to
echarts-bot[bot] closed issue #18176: [Bug]
URL: https://github.com/apache/echarts/issues/18176
--
This is an automated message from the Apache Git Service.
To respond to the message, please log on to GitHub and use the
URL above to go to the specific comment.
To unsubscribe, e-mail:
Kanglt opened a new issue, #18176:
URL: https://github.com/apache/echarts/issues/18176
### Version
5.4.1
### Link to Minimal Reproduction
_No response_
### Steps to Reproduce
var option = {
dataset: [
{
source: [
['Product',
github-actions[bot] closed issue #13970: Line Gradient Not working on Polar
coordinate system
URL: https://github.com/apache/echarts/issues/13970
--
This is an automated message from the Apache Git Service.
To respond to the message, please log on to GitHub and use the
URL above to go to the
github-actions[bot] closed issue #13965: 4.9.0开发环境地图可以正常加载,生产环境就报错,地图显示不出来
URL: https://github.com/apache/echarts/issues/13965
--
This is an automated message from the Apache Git Service.
To respond to the message, please log on to GitHub and use the
URL above to go to the specific comment.
github-actions[bot] commented on issue #11551:
URL: https://github.com/apache/echarts/issues/11551#issuecomment-1383252559
This issue has been automatically marked as stale because it did not have
recent activity. It will be closed in 7 days if no further activity occurs. If
you wish not
github-actions[bot] commented on issue #13970:
URL: https://github.com/apache/echarts/issues/13970#issuecomment-1383252609
This issue has been automatically closed because it did not have recent
activity. If this remains to be a problem with the latest version of Apache
ECharts, please
github-actions[bot] commented on issue #13965:
URL: https://github.com/apache/echarts/issues/13965#issuecomment-1383252604
This issue has been automatically closed because it did not have recent
activity. If this remains to be a problem with the latest version of Apache
ECharts, please
github-actions[bot] closed issue #13922: 使用雷达图,svg渲染模式,在配置信息 radius
100%时,iphone12 promax ,ios14.1版本出现多出一条线的bug,radius改99%后消失
URL: https://github.com/apache/echarts/issues/13922
--
This is an automated message from the Apache Git Service.
To respond to the message, please log on to GitHub
github-actions[bot] commented on issue #13922:
URL: https://github.com/apache/echarts/issues/13922#issuecomment-1383252593
This issue has been automatically closed because it did not have recent
activity. If this remains to be a problem with the latest version of Apache
ECharts, please
github-actions[bot] closed issue #12146: Map can not be dragged into the view
once roamed away after v4.6.0
URL: https://github.com/apache/echarts/issues/12146
--
This is an automated message from the Apache Git Service.
To respond to the message, please log on to GitHub and use the
URL
github-actions[bot] commented on issue #12146:
URL: https://github.com/apache/echarts/issues/12146#issuecomment-1383252569
This issue has been automatically closed because it did not have recent
activity. If this remains to be a problem with the latest version of Apache
ECharts, please
helgasoft commented on issue #18133:
URL: https://github.com/apache/echarts/issues/18133#issuecomment-1383093627
Lines are selectable on click, please see [this
code](https://github.com/apache/echarts/issues/2941#issuecomment-1355854785).
But you are right -
gzhong88 opened a new issue, #18175:
URL: https://github.com/apache/echarts/issues/18175
### Version
5.4.1
### Link to Minimal Reproduction
_No response_
### Steps to Reproduce
1. Use the following link to create the heatmap:
github-actions[bot] closed issue #13695: Multiple versions of echarts in one
document
URL: https://github.com/apache/echarts/issues/13695
--
This is an automated message from the Apache Git Service.
To respond to the message, please log on to GitHub and use the
URL above to go to the
github-actions[bot] commented on issue #13695:
URL: https://github.com/apache/echarts/issues/13695#issuecomment-1382918107
This issue has been automatically closed because it did not have recent
activity. If this remains to be a problem with the latest version of Apache
ECharts, please
JSjump commented on issue #6238:
URL: https://github.com/apache/echarts/issues/6238#issuecomment-1382684842
> startAngle
这样数据一旦变化又会有问题
--
This is an automated message from the Apache Git Service.
To respond to the message, please log on to GitHub and use the
URL above to go to the
Break-2020 commented on issue #18139:
URL: https://github.com/apache/echarts/issues/18139#issuecomment-1382671141
> MarkLine data can derive from main data - [this
helgasoft commented on issue #18139:
URL: https://github.com/apache/echarts/issues/18139#issuecomment-1382669860
> If I add markline, I also need to add a set of data for this...
MarkLine data can derive from main data - [this
Break-2020 commented on issue #18139:
URL: https://github.com/apache/echarts/issues/18139#issuecomment-1382667601
> Possible solution - [Demo
helgasoft commented on issue #18157:
URL: https://github.com/apache/echarts/issues/18157#issuecomment-1382667245
https://user-images.githubusercontent.com/13038071/212457482-f7161aac-35de-43b8-a4aa-acd5def66212.mp4
Is this the feature you want ? Dynamical horizontal or vertical
helgasoft commented on issue #18139:
URL: https://github.com/apache/echarts/issues/18139#issuecomment-1382665729
Possible solution - [Demo
plainheart commented on issue #18040:
URL: https://github.com/apache/echarts/issues/18040#issuecomment-1382653851
Added in
https://github.com/apache/echarts-doc/commit/de006d754f77a3cb5f12f23104a081792200e62a
--
This is an automated message from the Apache Git Service.
To respond to the
echarts-bot[bot] closed issue #18173: [Feature]
URL: https://github.com/apache/echarts/issues/18173
--
This is an automated message from the Apache Git Service.
To respond to the message, please log on to GitHub and use the
URL above to go to the specific comment.
To unsubscribe, e-mail:
Mingeax opened a new issue, #18174:
URL: https://github.com/apache/echarts/issues/18174
### Version
5.4.1
### Link to Minimal Reproduction
https://echarts.apache.org/examples/zh/editor.html?c=graph-force
### Steps to Reproduce
1. set the example options
geekerio closed issue #18165: [Bug] visualMap make all symbol color changed in
dataset model
URL: https://github.com/apache/echarts/issues/18165
--
This is an automated message from the Apache Git Service.
To respond to the message, please log on to GitHub and use the
URL above to go to the
geekerio commented on issue #18165:
URL: https://github.com/apache/echarts/issues/18165#issuecomment-1382635142
> Not a bug, just missing **seriesIndex**. Add it to _visualMap_: `
visualMap: { dimension: 2, seriesIndex: 1, ...}`
is work, thank you!
--
This is an automated message
Break-2020 closed issue #18139: [Feature] 家人们!柱状图中网格线与x轴刻度线、文本位置对齐的问题怎么解决呀
URL: https://github.com/apache/echarts/issues/18139
--
This is an automated message from the Apache Git Service.
To respond to the message, please log on to GitHub and use the
URL above to go to the specific comment.
Break-2020 commented on issue #18139:
URL: https://github.com/apache/echarts/issues/18139#issuecomment-1382619256
> Now I can only change the boundaryGap, this will make the graph go beyond
the axes
--
This is an automated message from the Apache Git Service.
To respond to the
Break-2020 commented on issue #18139:
URL: https://github.com/apache/echarts/issues/18139#issuecomment-1382618833
> boundaryGap
sorry,you can visit this link to see the effect
https://codesandbox.io/s/simple-example-of-dataset-forked-hkv2by?file=/index.js
I want to
krabouilleur opened a new issue, #18173:
URL: https://github.com/apache/echarts/issues/18173
### What problem does this feature solve?
There is no "series-lines.tooltip" in documenttaion but working on echarts
editor
There is a doc for tooltip for series type line but not for
krabouilleur commented on issue #18040:
URL: https://github.com/apache/echarts/issues/18040#issuecomment-1382438221
> Refer to https://echarts.apache.org/en/option.html#series-line.tooltip
No serie type "lineS" no series type "line"
krabouilleur commented on issue #18171:
URL: https://github.com/apache/echarts/issues/18171#issuecomment-1382418803
> Solutions already exist. For **SVG maps** one can just draw the border
inside the file. Example:
github-actions[bot] commented on issue #14038:
URL: https://github.com/apache/echarts/issues/14038#issuecomment-1382384857
This issue has been automatically marked as stale because it did not have
recent activity. It will be closed in 7 days if no further activity occurs. If
you wish not
github-actions[bot] commented on issue #14016:
URL: https://github.com/apache/echarts/issues/14016#issuecomment-1382384727
This issue has been automatically marked as stale because it did not have
recent activity. It will be closed in 7 days if no further activity occurs. If
you wish not
github-actions[bot] commented on issue #13937:
URL: https://github.com/apache/echarts/issues/13937#issuecomment-1382384607
This issue has been automatically marked as stale because it did not have
recent activity. It will be closed in 7 days if no further activity occurs. If
you wish not
xzf123456 commented on issue #14016:
URL: https://github.com/apache/echarts/issues/14016#issuecomment-1382385037
我已收到您的来信,祝您生活愉快,谢谢!
--
This is an automated message from the Apache Git Service.
To respond to the message, please log on to GitHub and use the
URL above to go to the specific
github-actions[bot] commented on issue #14041:
URL: https://github.com/apache/echarts/issues/14041#issuecomment-1382384894
This issue has been automatically marked as stale because it did not have
recent activity. It will be closed in 7 days if no further activity occurs. If
you wish not
github-actions[bot] commented on issue #14030:
URL: https://github.com/apache/echarts/issues/14030#issuecomment-1382384823
This issue has been automatically marked as stale because it did not have
recent activity. It will be closed in 7 days if no further activity occurs. If
you wish not
github-actions[bot] commented on issue #14025:
URL: https://github.com/apache/echarts/issues/14025#issuecomment-1382384786
This issue has been automatically marked as stale because it did not have
recent activity. It will be closed in 7 days if no further activity occurs. If
you wish not
github-actions[bot] commented on issue #13942:
URL: https://github.com/apache/echarts/issues/13942#issuecomment-1382384650
This issue has been automatically marked as stale because it did not have
recent activity. It will be closed in 7 days if no further activity occurs. If
you wish not
github-actions[bot] closed issue #13912: index in axisLabel’s formatter doesn't
work as expected when "inverse=true"
URL: https://github.com/apache/echarts/issues/13912
--
This is an automated message from the Apache Git Service.
To respond to the message, please log on to GitHub and use the
github-actions[bot] commented on issue #13912:
URL: https://github.com/apache/echarts/issues/13912#issuecomment-1382384566
This issue has been automatically closed because it did not have recent
activity. If this remains to be a problem with the latest version of Apache
ECharts, please
helgasoft commented on issue #18169:
URL: https://github.com/apache/echarts/issues/18169#issuecomment-1382364025
Doable with simple lines - [Demo
helgasoft commented on issue #18171:
URL: https://github.com/apache/echarts/issues/18171#issuecomment-1382269279
Solutions already exist.
For **SVG maps** one can just draw the border inside the file.
Example:
helgasoft commented on issue #18172:
URL: https://github.com/apache/echarts/issues/18172#issuecomment-1382188095
_"Instead of two pies, I would like one pie that combines both information"_
Could you please provide a drawing or picture of the desired result ?
--
This is an automated
helgasoft commented on issue #18141:
URL: https://github.com/apache/echarts/issues/18141#issuecomment-1382161009
_"...look into it"_ ?! And where is the code ?
--
This is an automated message from the Apache Git Service.
To respond to the message, please log on to GitHub and use the
URL
helgasoft commented on issue #18139:
URL: https://github.com/apache/echarts/issues/18139#issuecomment-1382155061
There may be a solution, but **complete reproducible code** is needed. Just
an image is not enough.
--
This is an automated message from the Apache Git Service.
To respond to
slindersAmsterdam opened a new issue, #18172:
URL: https://github.com/apache/echarts/issues/18172
### What problem does this feature solve?
Is it possible to make a pie chart that has an extra dimension on the radius?
So a normal pie chart based on value x of the dataset combined
MagicalBS closed issue #18167: [Bug] Grouped charts not synchronizing time axis
when data is missing
URL: https://github.com/apache/echarts/issues/18167
--
This is an automated message from the Apache Git Service.
To respond to the message, please log on to GitHub and use the
URL above to go
MagicalBS commented on issue #18167:
URL: https://github.com/apache/echarts/issues/18167#issuecomment-1381515110
> Why expect grouped charts to synchronize time axis ?
[connect](https://echarts.apache.org/en/api.html#echarts.connect) is defined as
_"Connects **interaction** of multiple
krabouilleur opened a new issue, #18171:
URL: https://github.com/apache/echarts/issues/18171
### What problem does this feature solve?
I would like to draw a border "solid" or "dashed" arround all map displayed
by a registermap
The map border would work when the map is loaded
helgasoft commented on issue #18167:
URL: https://github.com/apache/echarts/issues/18167#issuecomment-1381465409
Why expect grouped charts to synchronize time axis ?
[connect](https://echarts.apache.org/en/api.html#echarts.connect) is defined
as _"Connects **interaction** of multiple
helgasoft commented on issue #18166:
URL: https://github.com/apache/echarts/issues/18166#issuecomment-1381443825
Is there a problem to include **complete** reproducible code ?
--
This is an automated message from the Apache Git Service.
To respond to the message, please log on to GitHub
helgasoft commented on issue #18165:
URL: https://github.com/apache/echarts/issues/18165#issuecomment-1381439763
Not a bug, just missing **seriesIndex**.
Add it to _visualMap_: ``` visualMap: { dimension: 2, seriesIndex: 1, ...}```
--
This is an automated message from the Apache Git
helgasoft commented on issue #18160:
URL: https://github.com/apache/echarts/issues/18160#issuecomment-1381402143
Look at [this
example](https://echarts.apache.org/examples/en/editor.html?c=line-pen).
By clicking twice on the chart, you will get two points _pointInGridA_ and
kkai24 commented on issue #17414:
URL: https://github.com/apache/echarts/issues/17414#issuecomment-1381356318
+10086, i have a this probleam.
--
This is an automated message from the Apache Git Service.
To respond to the message, please log on to GitHub and use the
URL above to go to the
aurelien-boubennec commented on issue #7002:
URL: https://github.com/apache/echarts/issues/7002#issuecomment-1381309837
2 years later and I'm experiencing the same issue.
--
This is an automated message from the Apache Git Service.
To respond to the message, please log on to GitHub and
imyxiao opened a new issue, #18170:
URL: https://github.com/apache/echarts/issues/18170
### Version
5.4.1
### Link to Minimal Reproduction
https://echarts.apache.org/examples/en/editor.html?c=boxplot-light-velocity
### Steps to Reproduce
I'm testing boxplot
benliu723 commented on issue #12415:
URL: https://github.com/apache/echarts/issues/12415#issuecomment-1381281211
两年了咋没进展呢, 我还以为是我没找到配置, 原来确实没有自动计算标题位置. 这可就难受了,如果每个chart都需要手动给个nameGap, 那得多难受!
--
This is an automated message from the Apache Git Service.
To respond to the message, please log
plainheart closed issue #18145: [Bug]
chartInstance.on('click',params=>{debugger;}) click event can't be triggered
URL: https://github.com/apache/echarts/issues/18145
--
This is an automated message from the Apache Git Service.
To respond to the message, please log on to GitHub and use the
echarts-bot[bot] commented on issue #17958:
URL: https://github.com/apache/echarts/issues/17958#issuecomment-1381265739
This issue is closed due to not being active. Please feel free to open it
again (for the author) or create a new one and reference this (for others) if
you have further
echarts-bot[bot] closed issue #17958: [Bug] For line chart,when I set some
label's position on top,some label's position on bottom ,the labelline
position seems not right
URL: https://github.com/apache/echarts/issues/17958
--
This is an automated message from the Apache Git Service.
To
plainheart closed issue #18040: no series-line.tooltip exists in documentation
URL: https://github.com/apache/echarts/issues/18040
--
This is an automated message from the Apache Git Service.
To respond to the message, please log on to GitHub and use the
URL above to go to the specific
plainheart commented on issue #18040:
URL: https://github.com/apache/echarts/issues/18040#issuecomment-1381264646
Refer to https://echarts.apache.org/en/option.html#series-line.tooltip
--
This is an automated message from the Apache Git Service.
To respond to the message, please log on to
echarts-bot[bot] closed issue #18079: [Bug] Cannot read properties of null
(reading 'getModel')
URL: https://github.com/apache/echarts/issues/18079
--
This is an automated message from the Apache Git Service.
To respond to the message, please log on to GitHub and use the
URL above to go to
echarts-bot[bot] commented on issue #18079:
URL: https://github.com/apache/echarts/issues/18079#issuecomment-1381260513
This issue is closed due to not being active. Please feel free to open it
again (for the author) or create a new one and reference this (for others) if
you have further
plainheart commented on issue #18120:
URL: https://github.com/apache/echarts/issues/18120#issuecomment-1381259658
`setOption(option, true)` will fully replace the current option with the
passed option, which lacks the axis options. You should try
```js
setOption(option, {
plainheart closed issue #18120: [Bug] xAxis "0" not found
URL: https://github.com/apache/echarts/issues/18120
--
This is an automated message from the Apache Git Service.
To respond to the message, please log on to GitHub and use the
URL above to go to the specific comment.
To unsubscribe,
EAzari opened a new issue, #18169:
URL: https://github.com/apache/echarts/issues/18169
### What problem does this feature solve?
Hi, thank you for your valuable movement
We want to build this linear gauge with a linear clock with it, is thare any
suggestion?
github-actions[bot] commented on issue #14019:
URL: https://github.com/apache/echarts/issues/14019#issuecomment-1380991958
This issue has been automatically marked as stale because it did not have
recent activity. It will be closed in 7 days if no further activity occurs. If
you wish not
github-actions[bot] commented on issue #13920:
URL: https://github.com/apache/echarts/issues/13920#issuecomment-1380991878
This issue has been automatically closed because it did not have recent
activity. If this remains to be a problem with the latest version of Apache
ECharts, please
github-actions[bot] closed issue #13920: graph 的节点的阴影样式在Safari浏览器展示为方的
URL: https://github.com/apache/echarts/issues/13920
--
This is an automated message from the Apache Git Service.
To respond to the message, please log on to GitHub and use the
URL above to go to the specific comment.
To
github-actions[bot] commented on issue #5888:
URL: https://github.com/apache/echarts/issues/5888#issuecomment-1380991730
This issue has been automatically marked as stale because it did not have
recent activity. It will be closed in 7 days if no further activity occurs. If
you wish not to
TheHollows commented on issue #16975:
URL: https://github.com/apache/echarts/issues/16975#issuecomment-1380343136
+1 to this being a necessary feature. One cannot always rely on getting the
appropriate colour to set the border to, such as a case in which the background
is checkered.
--
cnovelli opened a new issue, #18168:
URL: https://github.com/apache/echarts/issues/18168
### What problem does this feature solve?
I have the hide overlap activate but when I hover on a label all the values
are shown and I want to show the same values that are shown through the hide
kchjxxgh commented on issue #10020:
URL: https://github.com/apache/echarts/issues/10020#issuecomment-1380182232
Is there any 3rd extension to support such interactive behavior, i.e. user
add annotation and add line.
If no, I assume in the future, echarts framework level should make some
MagicalBS opened a new issue, #18167:
URL: https://github.com/apache/echarts/issues/18167
### Version
5.4.0
### Link to Minimal Reproduction
_No response_
### Steps to Reproduce
Hello!
I have multiple charts with either one or two series each, all of
dependabot[bot] closed pull request #21: chore(deps): bump jsonwebtoken and
universal-github-app-jwt
URL: https://github.com/apache/echarts-bot/pull/21
--
This is an automated message from the Apache Git Service.
To respond to the message, please log on to GitHub and use the
URL above to go
dependabot[bot] commented on PR #21:
URL: https://github.com/apache/echarts-bot/pull/21#issuecomment-1380133232
Looks like these dependencies are up-to-date now, so this is no longer
needed.
--
This is an automated message from the Apache Git Service.
To respond to the message, please
dukeP commented on issue #15156:
URL: https://github.com/apache/echarts/issues/15156#issuecomment-1379980923
@pissang
[demo](https://codesandbox.io/s/temperature-change-in-the-coming-week-forked-tjlqym?file=/index.js:1107-1114)
目前(5.4.1)看起来这个问题还是存在,大部分情况下设置 name 属性都没有按预期生效
--
This is
longchuxiong opened a new issue, #18166:
URL: https://github.com/apache/echarts/issues/18166
### Version
5.3.3
### Link to Minimal Reproduction
_No response_
### Steps to Reproduce
` dataZoom: [
{
type: 'inside',
start: 0,
LBJDJW commented on issue #18158:
URL: https://github.com/apache/echarts/issues/18158#issuecomment-1379849733
我看了d3官网也是这么处理的,只展示三级的数据,但是会和我们的需求不符合,我们想要全部的数据展示,你说的对 最外面的数据变成一条线了,没意义
,谢谢大佬建议,我一会和产品沟通一下,我可以把我的配置项发你,我用我的数据放到官方的example里面,点击返回也是会卡的
--
This is an automated message from the
geekerio opened a new issue, #18165:
URL: https://github.com/apache/echarts/issues/18165
### Version
5.4.1
### Link to Minimal Reproduction
https://codesandbox.io/s/beijing-aqi-forked-ts460l?file=/index.js
### Steps to Reproduce
visualMap make all symbol
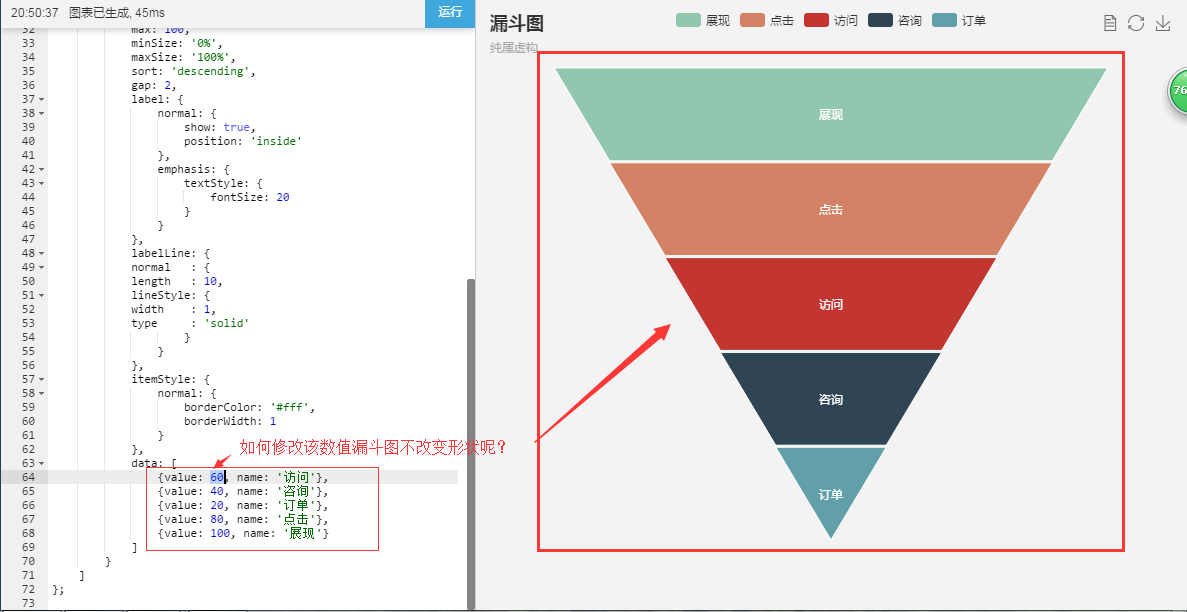
Charlie500 commented on issue #7206:
URL: https://github.com/apache/echarts/issues/7206#issuecomment-1379809880
> echarts 雷达图如何修改数值但却不改变形状的图形呢?
>
> 源码:
>
> ```js
>
Ovilia closed issue #18153: [Bug] x 轴在动态数据时,没有设置缓动动画过度时间的配置
URL: https://github.com/apache/echarts/issues/18153
--
This is an automated message from the Apache Git Service.
To respond to the message, please log on to GitHub and use the
URL above to go to the specific comment.
To unsubscribe,
Ovilia commented on issue #18153:
URL: https://github.com/apache/echarts/issues/18153#issuecomment-1379744052
Thanks! I've updated the doc.
--
This is an automated message from the Apache Git Service.
To respond to the message, please log on to GitHub and use the
URL above to go to the
Ovilia commented on issue #18158:
URL: https://github.com/apache/echarts/issues/18158#issuecomment-1379734798
是不是可以考虑点击后再展现下级的详细信息呢,即使没有性能问题,6000 条数据平均每条 不到 1° 的角度看不清也没有任何意义的
--
This is an automated message from the Apache Git Service.
To respond to the message, please log on to GitHub
github-actions[bot] commented on issue #13959:
URL: https://github.com/apache/echarts/issues/13959#issuecomment-1379482173
This issue has been automatically marked as stale because it did not have
recent activity. It will be closed in 7 days if no further activity occurs. If
you wish not
github-actions[bot] commented on issue #13857:
URL: https://github.com/apache/echarts/issues/13857#issuecomment-1379482114
This issue has been automatically marked as stale because it did not have
recent activity. It will be closed in 7 days if no further activity occurs. If
you wish not
ElayGelbart commented on PR #17451:
URL: https://github.com/apache/echarts/pull/17451#issuecomment-1378767507
This feature is ready to release in Feb or there are other requested changes
?
--
This is an automated message from the Apache Git Service.
To respond to the message, please log
sovushka-utrom commented on issue #9552:
URL: https://github.com/apache/echarts/issues/9552#issuecomment-1378744941
@mathiasleroy,
> symbol: 'line', symbolSize:0,
Thank you for this one!
As for the topic, adding
```
lineStyle: {
type: 'dashed',
Caceresenzo commented on issue #17391:
URL: https://github.com/apache/echarts/issues/17391#issuecomment-1378655527
They seems to have changed the way they store the themes, and so the theme
builder is not working anymore...
In the meantime, you can "update" the color by hand:
zhiqingchen commented on issue #18120:
URL: https://github.com/apache/echarts/issues/18120#issuecomment-1378547349
```js
echarts.use([
GridComponent,
])
```
--
This is an automated message from the Apache Git Service.
To respond to the message, please log on to GitHub and
zhenhuiWang commented on issue #15757:
URL: https://github.com/apache/echarts/issues/15757#issuecomment-1378465358
> @htr3n It will be included in the 5.3.0 which will be released later this
month.
I had the same problem, my echarts version is 5.4.1, this problem still
exists.
--
DoubleCorner commented on issue #17138:
URL: https://github.com/apache/echarts/issues/17138#issuecomment-1378417036
Will this feature be implemented in the next version?
--
This is an automated message from the Apache Git Service.
To respond to the message, please log on to GitHub and use
yuhao-git commented on issue #7234:
URL: https://github.com/apache/echarts/issues/7234#issuecomment-1378408432
请问下,如果chart实例不放在vue的data中,组件复用怎么解决呢?
--
This is an automated message from the Apache Git Service.
To respond to the message, please log on to GitHub and use the
URL above to go
101 - 200 of 45085 matches
Mail list logo