deqingli closed issue #8069: 堆积bar图在设置“缩放区域”工具栏按钮后不能正常显示
URL: https://github.com/apache/incubator-echarts/issues/8069
This is an automated message from the Apache Git Service.
To respond to the message, please log on to
Ovilia commented on issue #11274: `connectNulls` with stepLine fails when after
a long number of `null` entries occur
URL:
https://github.com/apache/incubator-echarts/issues/11274#issuecomment-532944487
@atanasbozhkov Thanks for reporting. I think it makes sense for step line
charts to
100pah commented on a change in pull request #11212: fix bug #11049
URL:
https://github.com/apache/incubator-echarts/pull/11212#discussion_r326032832
##
File path: src/component/toolbox/feature/DataZoom.js
##
@@ -269,7 +269,7 @@ echarts.registerPreprocessor(function
echarts-robot[bot] commented on issue #11281: UMD wrapper may be need to update
to fit some env that not standard
URL:
https://github.com/apache/incubator-echarts/issues/11281#issuecomment-533042639
Hi! We've received your issue and please be patient to get responded.
The average
100pah opened a new issue #11281: UMD wrapper may be need to update to fit some
env that not standard
URL: https://github.com/apache/incubator-echarts/issues/11281
### Version
4.3.0
### Steps to reproduce
Record an issue here:
In some runtime environment that not standard
icetimidus edited a comment on issue #11226: 柱状图中series指定的dataset定位错误
URL:
https://github.com/apache/incubator-echarts/issues/11226#issuecomment-531729930
https://user-images.githubusercontent.com/2377333/64952002-c22c3980-d8b1-11e9-8bdd-c8109c20fb71.png;>
xukui529 commented on issue #8313: Feature: tree 增加直角线条功能
URL:
https://github.com/apache/incubator-echarts/issues/8313#issuecomment-532946789
只有2.x版本是直角
This is an automated message from the Apache Git Service.
To respond to
Amos729 closed issue #11277: iOS &
Android使用dataZoom属性进行缩放功能,当缩放到最大程度(x轴只显示1条数据时),还可以继续放大?
URL: https://github.com/apache/incubator-echarts/issues/11277
This is an automated message from the Apache Git Service.
To respond
Amos729 commented on issue #11277: iOS &
Android使用dataZoom属性进行缩放功能,当缩放到最大程度(x轴只显示1条数据时),还可以继续放大?
URL:
https://github.com/apache/incubator-echarts/issues/11277#issuecomment-532955439
>
[minSpan](https://echarts.apache.org/zh/option.html#dataZoom-inside.minSpan)
and
Ovilia commented on issue #11236: Stack icon doesn't toggle
URL:
https://github.com/apache/incubator-echarts/issues/11236#issuecomment-532972905
Oh, I see...
This is an automated message from the Apache Git Service.
To
echarts-robot[bot] closed issue #11279: 树图所有连接线都是曲线,能不能加个属性可以设置成折线
URL: https://github.com/apache/incubator-echarts/issues/11279
This is an automated message from the Apache Git Service.
To respond to the message, please log
echarts-robot[bot] commented on issue #11279: 树图所有连接线都是曲线,能不能加个属性可以设置成折线
URL:
https://github.com/apache/incubator-echarts/issues/11279#issuecomment-532980685
This issue is not created using [issue
template](https://ecomfe.github.io/echarts-issue-helper/) so I'm going to close
it.
Ovilia commented on issue #11155: Chart is taking 0 width of its container div,
when the parent element is initially hidden
URL:
https://github.com/apache/incubator-echarts/issues/11155#issuecomment-532985372
@dileepyelleti This seems to be a general JS problem. See if this helps:
fuyunfeng961010 opened a new issue #11284: X轴的 文字能否紧贴刻度线布局
URL: https://github.com/apache/incubator-echarts/issues/11284
### Version
4.3.0
### Reproduction link
echarts-robot[bot] commented on issue #11284: X轴的 文字能否紧贴刻度线布局
URL:
https://github.com/apache/incubator-echarts/issues/11284#issuecomment-533059027
Hi! We've received your issue and please be patient to get responded.
The average response time is expected to be within one day for
fuyunfeng961010 commented on issue #11284: X轴的 文字能否紧贴刻度线布局
URL:
https://github.com/apache/incubator-echarts/issues/11284#issuecomment-533064523

实际是这样的效果 我现在的问题是标红文字处在
stale[bot] commented on issue #4856: 环形图 进度条两端如何设置圆角?
URL:
https://github.com/apache/incubator-echarts/issues/4856#issuecomment-533069602
This issue is marked to be `stale` and is going to be closed within a week.
If you think it shouldn't be closed, please leave a comment.
chenxia123 opened a new issue #4856: 环形图 进度条两端如何设置圆角?
URL: https://github.com/apache/incubator-echarts/issues/4856
### One-line summary [问题简述]
想给环形图进度条两端设置圆角,但是好像只有柱状图有barBorderRadius属性。
### Version & Environment [版本及环境]
+ ECharts version [ECharts 版本]:
Ovilia commented on issue #11272: fix(map): map transform changed from geo
coord to screen position; fix #11055
URL:
https://github.com/apache/incubator-echarts/pull/11272#issuecomment-533114827
I will check with #5429 tomorrow.
Ovilia commented on issue #11278: 主题构建工具需要添加关于渐变色的全局配置项
URL:
https://github.com/apache/incubator-echarts/issues/11278#issuecomment-533139456
把你写的这个 gradient 值作为一个变量存着,其他地方也使用这个变量,会有什么不方便吗?
This is an automated message from
Ovilia opened a new issue #11287: [feature] map events handling area
URL: https://github.com/apache/incubator-echarts/issues/11287
Currently, the map events like roaming and zooming are only responded within
the bounding box of the map. It is inconvenient and sometimes confusing. A
better
dangoldstein commented on issue #11260: Overlapping Links in Graph
URL:
https://github.com/apache/incubator-echarts/issues/11260#issuecomment-533076797
> Duplicate of #11260
You referenced this issue ..
This is an
lelesu edited a comment on issue #11286: 官方实例Stacked Line Chart Y轴数据显示错误
URL:
https://github.com/apache/incubator-echarts/issues/11286#issuecomment-533078892
option = {
title: {
text: '折线图堆叠'
},
tooltip: {
trigger: 'axis'
},
legend:
lelesu commented on issue #11286: 官方实例Stacked Line Chart Y轴数据显示错误
URL:
https://github.com/apache/incubator-echarts/issues/11286#issuecomment-533078892
option = {
title: {
text: '折线图堆叠'
},
tooltip: {
trigger: 'axis'
},
legend: {
MarxZhou commented on issue #11278: 主题构建工具需要添加关于渐变色的全局配置项
URL:
https://github.com/apache/incubator-echarts/issues/11278#issuecomment-533142487
> 把你写的这个 gradient 值作为一个变量存着,其他地方也使用这个变量,会有什么不方便吗?
没有,可以随意处理。
This is an
lelesu edited a comment on issue #11286: 官方实例Stacked Line Chart Y轴数据显示错误
URL:
https://github.com/apache/incubator-echarts/issues/11286#issuecomment-533078892
`option = {
title: {
text: '折线图堆叠'
},
tooltip: {
trigger: 'axis'
},
legend:
pissang commented on issue #11285: new feature Fix9215 add event ''brushEnd"
URL:
https://github.com/apache/incubator-echarts/pull/11285#issuecomment-533081512
Thanks cuijian!
This is an automated message from the Apache
100pah commented on a change in pull request #11295: fix bug #7340
URL:
https://github.com/apache/incubator-echarts/pull/11295#discussion_r326705285
##
File path: test/lengend-borderColor.html
##
@@ -0,0 +1,402 @@
100pah commented on a change in pull request #11295: fix bug #7340
URL:
https://github.com/apache/incubator-echarts/pull/11295#discussion_r326707760
##
File path: test/lengend-borderColor.html
##
@@ -0,0 +1,402 @@
+
+
+
+
+
+
+
+
+
+
+
+
+
+h1
100pah commented on a change in pull request #11295: fix bug #7340
URL:
https://github.com/apache/incubator-echarts/pull/11295#discussion_r326720837
##
File path: src/visual/dataColor.js
##
@@ -74,6 +77,25 @@ export default function (seriesType) {
//
100pah commented on a change in pull request #11295: fix bug #7340
URL:
https://github.com/apache/incubator-echarts/pull/11295#discussion_r326724836
##
File path: src/visual/seriesColor.js
##
@@ -41,16 +50,23 @@ export default {
data.setItemVisual(
100pah commented on a change in pull request #11295: fix bug #7340
URL:
https://github.com/apache/incubator-echarts/pull/11295#discussion_r326706413
##
File path: test/lengend-borderColor.html
##
@@ -0,0 +1,402 @@
+
+
+
+
+
+
+
+
+
+
+
+
+
+h1
100pah commented on a change in pull request #11295: fix bug #7340
URL:
https://github.com/apache/incubator-echarts/pull/11295#discussion_r326712739
##
File path: src/component/legend/LegendView.js
##
@@ -481,6 +503,17 @@ export default echarts.extendComponentView({
100pah commented on a change in pull request #11295: fix bug #7340
URL:
https://github.com/apache/incubator-echarts/pull/11295#discussion_r326722370
##
File path: src/visual/dataColor.js
##
@@ -74,6 +77,25 @@ export default function (seriesType) {
//
100pah commented on a change in pull request #11295: fix bug #7340
URL:
https://github.com/apache/incubator-echarts/pull/11295#discussion_r326723806
##
File path: src/visual/seriesColor.js
##
@@ -33,6 +33,15 @@ export default {
// FIXME Set color function or
100pah commented on a change in pull request #11295: fix bug #7340
URL:
https://github.com/apache/incubator-echarts/pull/11295#discussion_r326717331
##
File path: src/component/legend/LegendView.js
##
@@ -481,6 +503,17 @@ export default echarts.extendComponentView({
100pah commented on a change in pull request #11295: fix bug #7340
URL:
https://github.com/apache/incubator-echarts/pull/11295#discussion_r326709333
##
File path: src/component/legend/LegendModel.js
##
@@ -283,6 +283,14 @@ var LegendModel = echarts.extendComponentModel({
100pah commented on a change in pull request #11295: fix bug #7340
URL:
https://github.com/apache/incubator-echarts/pull/11295#discussion_r326723299
##
File path: src/visual/seriesColor.js
##
@@ -33,6 +33,15 @@ export default {
// FIXME Set color function or
100pah commented on a change in pull request #11295: fix bug #7340
URL:
https://github.com/apache/incubator-echarts/pull/11295#discussion_r326721619
##
File path: src/visual/dataColor.js
##
@@ -74,6 +77,25 @@ export default function (seriesType) {
//
100pah commented on a change in pull request #11295: fix bug #7340
URL:
https://github.com/apache/incubator-echarts/pull/11295#discussion_r326723301
##
File path: src/visual/seriesColor.js
##
@@ -33,6 +33,15 @@ export default {
// FIXME Set color function or
100pah commented on a change in pull request #11295: fix bug #7340
URL:
https://github.com/apache/incubator-echarts/pull/11295#discussion_r326706221
##
File path: test/lengend-borderColor.html
##
@@ -0,0 +1,402 @@
+
+
+
+
+
+
+
+
+
+
+
+
+
+h1
alex2wong opened a new pull request #11297: Fix contributing doc missing issue
URL: https://github.com/apache/incubator-echarts/pull/11297
contributing doc was moved to root dir. since doc fix branch in apache repo
also fall behind master branch ,so merge to apache/incubator-echarts master
100pah commented on issue #9269: 地图无数据的区域,无法使用formtter修改显示的label
URL:
https://github.com/apache/incubator-echarts/issues/9269#issuecomment-533240142
Fixed since 4.2.1
This is an automated message from the Apache Git Service.
mechmillan commented on issue #9402: Cannot read property 'getRawIndex' of
undefined
URL:
https://github.com/apache/incubator-echarts/issues/9402#issuecomment-533186359
I'm seeing the same on echarts `4.1.0` and `4.3.0` and `echarts-for-react
2.0.14`, `echarts-for-react 2.0.15-beta.0`,
100pah commented on a change in pull request #11283: Add clip option for line,
bar, lines, scatter, custom series
URL:
https://github.com/apache/incubator-echarts/pull/11283#discussion_r326123409
##
File path: src/chart/bar/BarView.js
##
@@ -191,6 +231,53 @@ export
100pah commented on a change in pull request #11283: Add clip option for line,
bar, lines, scatter, custom series
URL:
https://github.com/apache/incubator-echarts/pull/11283#discussion_r326124588
##
File path: src/chart/bar/BarView.js
##
@@ -158,6 +187,17 @@ export
echarts-robot[bot] commented on issue #11288: AxisPointer make a hidden symbol
display in line chart
URL:
https://github.com/apache/incubator-echarts/issues/11288#issuecomment-533182054
Hi! We've received your issue and please be patient to get responded.
The average response time is
100pah opened a new issue #11288: AxisPointer make a hidden symbol display in
line chart
URL: https://github.com/apache/incubator-echarts/issues/11288
### Version
4.1.0-release
### Reproduction link
Edgar-cn opened a new issue #11296: tooltip提示框动画效果引发的问题
URL: https://github.com/apache/incubator-echarts/issues/11296
echarts 示例中雷达图的多雷达图模块,当数据过多时tooltip提示框会有一个从下到上的动画效果,会挤出多余网页空间,导致页面闪烁的问题
This is an automated message
echarts-robot[bot] commented on issue #11296: tooltip提示框动画效果引发的问题
URL:
https://github.com/apache/incubator-echarts/issues/11296#issuecomment-533763720
This issue is not created using [issue
template](https://ecomfe.github.io/echarts-issue-helper/) so I'm going to close
it.
Sorry for
ankushjamdagani commented on issue #9402: Cannot read property 'getRawIndex' of
undefined
URL:
https://github.com/apache/incubator-echarts/issues/9402#issuecomment-533263332
# Issue Reason
I was passing every dynamic config to`echarts-for-react` component as a
prop. Config consited of
fuyunfeng961010 edited a comment on issue #11284: X轴的 文字能否紧贴刻度线布局
URL:
https://github.com/apache/incubator-echarts/issues/11284#issuecomment-533371460
@Ovilia align属性貌似并达不到我预期的效果 期望的是文字能够紧贴刻度线 如图
Ovilia commented on issue #11267: 折线图在图表容器宽高更高情况下,图表被严重压缩,无法正确显示
URL:
https://github.com/apache/incubator-echarts/issues/11267#issuecomment-533372414
@alex2wong That's an excellent job!
@100pah Please help look at the comment to see if @alex2wong could make a
pull request here.
Ovilia commented on issue #11278: 主题构建工具需要添加关于渐变色的全局配置项
URL:
https://github.com/apache/incubator-echarts/issues/11278#issuecomment-533372779
那这个问题就解决了?
This is an automated message from the Apache Git Service.
To respond to
pissang edited a comment on issue #11267: 折线图在图表容器宽高更高情况下,图表被严重压缩,无法正确显示
URL:
https://github.com/apache/incubator-echarts/issues/11267#issuecomment-533374361
Thanks, @alex2wong . The grid top is a fixed height by default. It's for the
space of legend, title, toolbox or other components.
kangning1206 opened a new issue #11289: 网站页面
https://gallery.echartsjs.com/help.html 增加搜索
URL: https://github.com/apache/incubator-echarts/issues/11289
echars官网 【问题交流】版本怎么没有搜索?难道是我没找到?太不方便了;
https://gallery.echartsjs.com/help.html
我需要搜索geo坐标,是不是对dataZoom缩放不支持,我现在移动端需要对地图手势缩放。
echarts-robot[bot] closed issue #11289: 网站页面
https://gallery.echartsjs.com/help.html 增加搜索
URL: https://github.com/apache/incubator-echarts/issues/11289
This is an automated message from the Apache Git Service.
To respond
echarts-robot[bot] commented on issue #11289: 网站页面
https://gallery.echartsjs.com/help.html 增加搜索
URL:
https://github.com/apache/incubator-echarts/issues/11289#issuecomment-533391230
This issue is not created using [issue
template](https://ecomfe.github.io/echarts-issue-helper/) so I'm
Ovilia commented on issue #11278: 主题构建工具需要添加关于渐变色的全局配置项
URL:
https://github.com/apache/incubator-echarts/issues/11278#issuecomment-533407920
为什么是「开关」?其实就是你把传入的 option 记录一下,下次在这个基础上改就行了。
This is an automated message from the
MarxZhou commented on issue #11278: 主题构建工具需要添加关于渐变色的全局配置项
URL:
https://github.com/apache/incubator-echarts/issues/11278#issuecomment-533415930
> 为什么是「开关」?其实就是你把传入的 option 记录一下,下次在这个基础上改就行了。
我可能没有描述清楚。
This is an
MarxZhou removed a comment on issue #11278: 主题构建工具需要添加关于渐变色的全局配置项
URL:
https://github.com/apache/incubator-echarts/issues/11278#issuecomment-533415930
> 为什么是「开关」?其实就是你把传入的 option 记录一下,下次在这个基础上改就行了。
我可能没有描述清楚。
This is
Ovilia commented on issue #11288: AxisPointer make a hidden symbol display in
line chart
URL:
https://github.com/apache/incubator-echarts/issues/11288#issuecomment-533373883
Please provide a demo based on https://jsfiddle.net/ovilia/n6xc4df3/
fuyunfeng961010 commented on issue #11284: X轴的 文字能否紧贴刻度线布局
URL:
https://github.com/apache/incubator-echarts/issues/11284#issuecomment-533374629
@Ovilia 谢谢 但rich属性中貌似也并没有能解决当前问题的属性 我早已尝试过 或许是我没有找到正确的方法
This is an automated
pissang merged pull request #11283: Add clip option for line, bar, lines,
scatter, custom series
URL: https://github.com/apache/incubator-echarts/pull/11283
This is an automated message from the Apache Git Service.
To
MarxZhou commented on issue #11278: 主题构建工具需要添加关于渐变色的全局配置项
URL:
https://github.com/apache/incubator-echarts/issues/11278#issuecomment-533376229
> 那这个问题就解决了?
MarxZhou commented on issue #11278: 主题构建工具需要添加关于渐变色的全局配置项
URL:
https://github.com/apache/incubator-echarts/issues/11278#issuecomment-533416362
> 为什么是「开关」?其实就是你把传入的 option 记录一下,下次在这个基础上改就行了。
我之前没有描述清楚。
我希望这里既可以传入自定义配置,也可以支持布尔值。
MarxZhou removed a comment on issue #11278: 主题构建工具需要添加关于渐变色的全局配置项
URL:
https://github.com/apache/incubator-echarts/issues/11278#issuecomment-533416362
> 为什么是「开关」?其实就是你把传入的 option 记录一下,下次在这个基础上改就行了。
我之前没有描述清楚。
我希望这里既可以传入自定义配置,也可以支持布尔值。
surplus-cat commented on issue #5346: y坐标轴标题(name)文字位置不能相对于y轴居左的问题
URL:
https://github.com/apache/incubator-echarts/issues/5346#issuecomment-533416190
nameRotate 的单位不是px吧,而且设置成0.1和1 效果都是一样的,需求是要求和legend 左对齐,发现只能通过加空格对齐。
This
echarts-robot[bot] closed issue #11286: 官方实例Stacked Line Chart Y轴数据显示错误
URL: https://github.com/apache/incubator-echarts/issues/11286
This is an automated message from the Apache Git Service.
To respond to the message,
lelesu opened a new issue #11286: 官方实例Stacked Line Chart Y轴数据显示错误
URL: https://github.com/apache/incubator-echarts/issues/11286
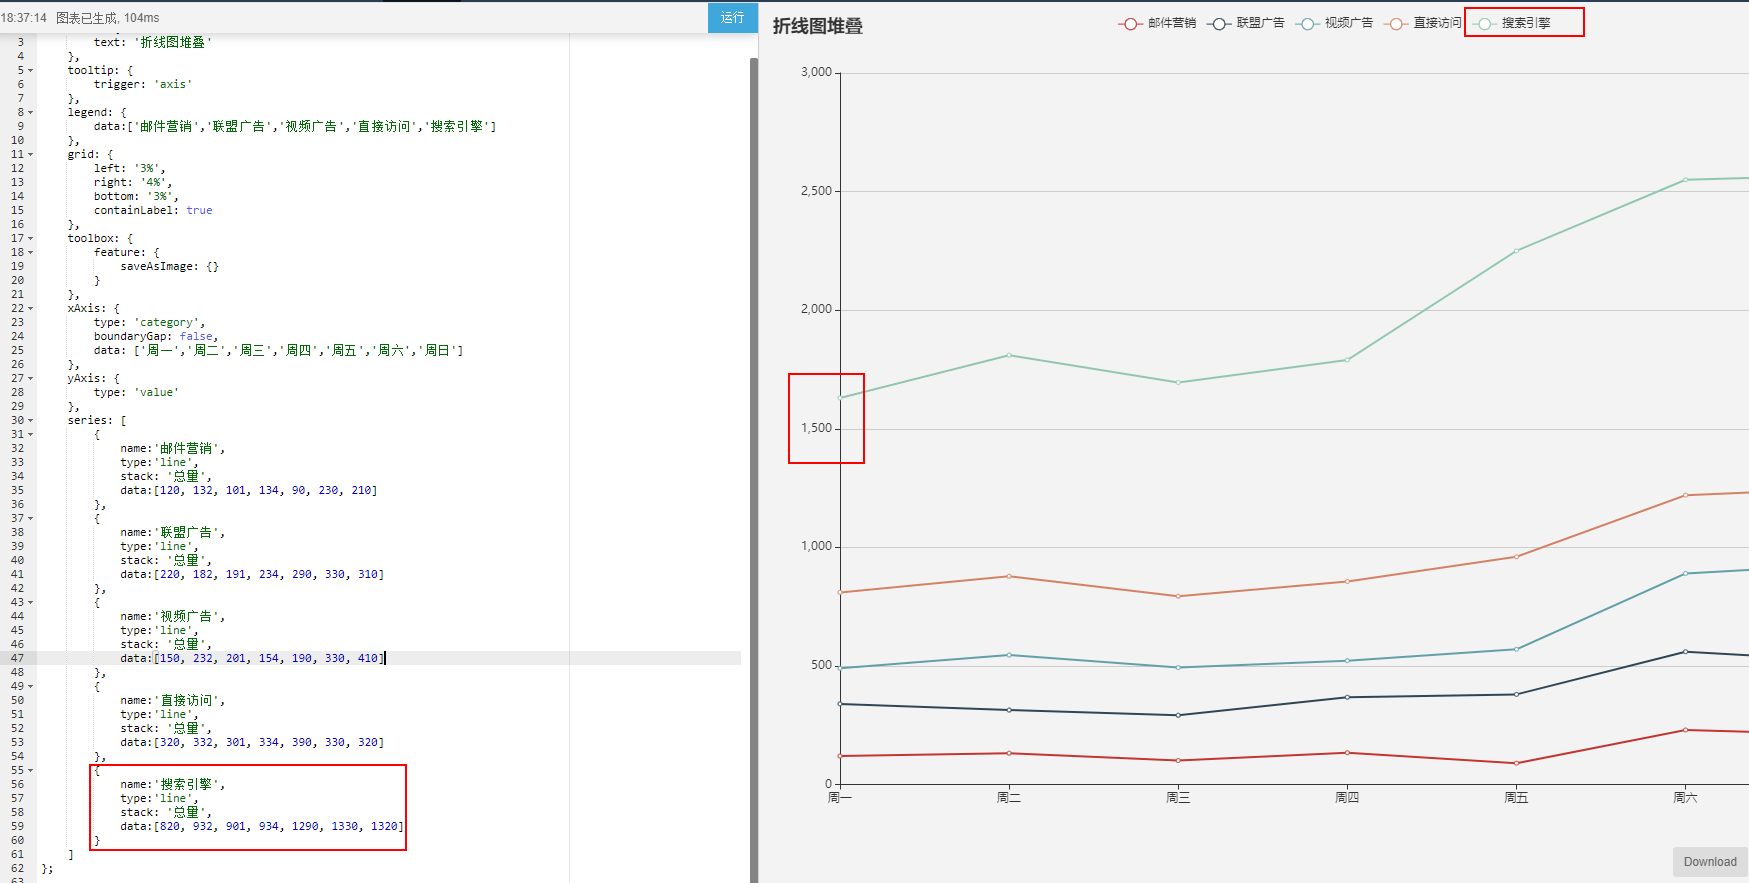
echarts-robot[bot] commented on issue #11286: 官方实例Stacked Line Chart Y轴数据显示错误
URL:
https://github.com/apache/incubator-echarts/issues/11286#issuecomment-533075259
This issue is not created using [issue
template](https://ecomfe.github.io/echarts-issue-helper/) so I'm going to close
it.
Ovilia commented on issue #11284: X轴的 文字能否紧贴刻度线布局
URL:
https://github.com/apache/incubator-echarts/issues/11284#issuecomment-533141539
https://echarts.apache.org/en/option.html#xAxis.axisLabel.align
This is an automated
Ovilia commented on issue #11284: X轴的 文字能否紧贴刻度线布局
URL:
https://github.com/apache/incubator-echarts/issues/11284#issuecomment-533373639
可以试试富文本,可以实现比较复杂的文字效果:https://echarts.apache.org/zh/option.html#xAxis.axisLabel.rich
pissang closed issue #8935: Stacked Bar with dataZoom regression (4.1.0)
URL: https://github.com/apache/incubator-echarts/issues/8935
This is an automated message from the Apache Git Service.
To respond to the message,
pissang closed issue #8848: bug: Bar series with multiple axis
URL: https://github.com/apache/incubator-echarts/issues/8848
This is an automated message from the Apache Git Service.
To respond to the message, please log on
pissang closed issue #11086: Bug with stack bar with min value
URL: https://github.com/apache/incubator-echarts/issues/11086
This is an automated message from the Apache Git Service.
To respond to the message, please log on
pissang closed issue #9751: geo event with geoRoam
URL: https://github.com/apache/incubator-echarts/issues/9751
This is an automated message from the Apache Git Service.
To respond to the message, please log on to GitHub and
pissang edited a comment on issue #11267: 折线图在图表容器宽高更高情况下,图表被严重压缩,无法正确显示
URL:
https://github.com/apache/incubator-echarts/issues/11267#issuecomment-533374361
Thanks, @alex2wong . The grid top is a fixed height by default. It's for the
space of legend, title, toolbox or other components.
pissang edited a comment on issue #11267: 折线图在图表容器宽高更高情况下,图表被严重压缩,无法正确显示
URL:
https://github.com/apache/incubator-echarts/issues/11267#issuecomment-533374361
Thanks, @alex2wong . The grid top is a fixed height id default for the space
of legend, title, toolbox or other components.
microchang commented on issue #11241:
用graphic实现拖拽的散点图,当series开启large:true,且点的数量超过largeThreshold 的设置时候,tooltip消失
URL:
https://github.com/apache/incubator-echarts/issues/11241#issuecomment-533406437
hello?
This is an
Ovilia commented on issue #11241:
用graphic实现拖拽的散点图,当series开启large:true,且点的数量超过largeThreshold 的设置时候,tooltip消失
URL:
https://github.com/apache/incubator-echarts/issues/11241#issuecomment-533408555
Remove the `triggerOn: 'none'` and you will have the tooltip.
MarxZhou commented on issue #11278: 主题构建工具需要添加关于渐变色的全局配置项
URL:
https://github.com/apache/incubator-echarts/issues/11278#issuecomment-533418348
> 为什么是「开关」?其实就是你把传入的 option 记录一下,下次在这个基础上改就行了。
我之前没有描述清楚。
我希望这里既可以传入自定义配置,也可以支持布尔值。
例如传入一个truthy后,可以自动实现类似下图中的简单渐变色效果。
alex2wong commented on issue #11267: 折线图在图表容器宽高更高情况下,图表被严重压缩,无法正确显示
URL:
https://github.com/apache/incubator-echarts/issues/11267#issuecomment-533361806
Hi team, I may find some clue. As you can see, the grid rect has a big top
(about 60 px) relative to the canvas.
fuyunfeng961010 commented on issue #11284: X轴的 文字能否紧贴刻度线布局
URL:
https://github.com/apache/incubator-echarts/issues/11284#issuecomment-533371460
@Ovilia align属性貌似并达不到我预期的效果 期望的是文字能够紧贴刻度线 如图
echarts-robot[bot] commented on issue #11277: iOS &
Android使用dataZoom属性进行缩放功能,当缩放到最大程度(x轴只显示1条数据时),还可以继续放大?
URL:
https://github.com/apache/incubator-echarts/issues/11277#issuecomment-532940727
Hi! We've received your issue and please be patient to get responded.
The average response
Amos729 opened a new issue #11277: iOS &
Android使用dataZoom属性进行缩放功能,当缩放到最大程度(x轴只显示1条数据时),还可以继续放大?
URL: https://github.com/apache/incubator-echarts/issues/11277
### Version
4.3.0
### Steps to reproduce
## 环境及平台
- iOS & Android
- React Native
## 代码
pissang opened a new pull request #11294: fix(clip): fix line disappears on
polar with clip enabled
URL: https://github.com/apache/incubator-echarts/pull/11294
This is an automated message from the Apache Git Service.
To
pissang merged pull request #11291: test: recorded zoom action in related test
cases.
URL: https://github.com/apache/incubator-echarts/pull/11291
This is an automated message from the Apache Git Service.
To respond to the
pissang merged pull request #11294: fix(clip): fix line disappears on polar
with clip enabled
URL: https://github.com/apache/incubator-echarts/pull/11294
This is an automated message from the Apache Git Service.
To respond
von-mo commented on issue #9687: 4.2.0版本如何动态添加地图标注
URL:
https://github.com/apache/incubator-echarts/issues/9687#issuecomment-536199565
```
var data = [
{name: '海门', value: 9},
]
```
有谁知道这个里面的这个`value`代表的是啥意思吗 , 一直很好奇 感谢
von-mo commented on issue #9687: 4.2.0版本如何动态添加地图标注
URL:
https://github.com/apache/incubator-echarts/issues/9687#issuecomment-536205645
```
var data = [
{ name: "胶南", value: 22 },
{ name: "江阴", value: 37 },
]
```
有哪位朋友能够告知下, 这里面城市里的`value`代表的是什么意思吗?
感谢 ~
von-mo removed a comment on issue #9687: 4.2.0版本如何动态添加地图标注
URL:
https://github.com/apache/incubator-echarts/issues/9687#issuecomment-536199565
```
var data = [
{name: '海门', value: 9},
]
```
有谁知道这个里面的这个`value`代表的是啥意思吗 , 一直很好奇 感谢
Ovilia commented on issue #11322: Bar chart pick the wrong data in dataset.
URL:
https://github.com/apache/incubator-echarts/issues/11322#issuecomment-535365978
You should probably check the data before passing to ECharts for now.
Ovilia opened a new pull request #11332: test(util): export quantityExponent
and add ut #11249
URL: https://github.com/apache/incubator-echarts/pull/11332
test(util): export quantityExponent and add ut #11249
This is an
gajus opened a new issue #11333: Bar series is bar width is not adjusted when
xAxis is time and min/max is defined
URL: https://github.com/apache/incubator-echarts/issues/11333
### Version
4.3.0
### Reproduction link
saviorZSC commented on issue #7755: 在China地图中不显示南沙群岛的九段线标识
URL:
https://github.com/apache/incubator-echarts/issues/7755#issuecomment-535377307
@Ovilia 在echarts-gl中,中国三维地图没有南沙群岛的部分,请问如何解决
This is an automated message from the
icetimidus commented on issue #11322: Bar chart pick the wrong data in dataset.
URL:
https://github.com/apache/incubator-echarts/issues/11322#issuecomment-535323169
@Ovilia
No, the data will missing when it be zero. I think that's the problem is.
chillyond opened a new issue #11329: 鼠标移出图表后symbol和tooltip残留
URL: https://github.com/apache/incubator-echarts/issues/11329
### Version
3.5.3
### Steps to reproduce
创建一个小尺寸的折线图表,开启tooltip功能,鼠标快速在图表上来回移入移出几次,很容易出现这个问题:
Ovilia closed issue #11330: angular 6 打包完之后echarts 图表不显示
URL: https://github.com/apache/incubator-echarts/issues/11330
This is an automated message from the Apache Git Service.
To respond to the message, please log on to
Ovilia commented on issue #11330: angular 6 打包完之后echarts 图表不显示
URL:
https://github.com/apache/incubator-echarts/issues/11330#issuecomment-535395102
你好,请检查第三方项目相关问题,这个问题应该与 ECharts 无关。
This is an automated message from the
801 - 900 of 45085 matches
Mail list logo