slindersAmsterdam opened a new issue, #18201:
URL: https://github.com/apache/echarts/issues/18201
### Version
52.2
### Link to Minimal Reproduction
_No response_
### Steps to Reproduce
The drilldown function doesnt work with encode. When 'data' gets
infacto opened a new issue, #18200:
URL: https://github.com/apache/echarts/issues/18200
### Version
5.4.1
### Link to Minimal Reproduction
https://echarts.apache.org/examples/en/editor.html?c=custom-profile
### Steps to Reproduce
Check out the link above.
infacto opened a new issue, #18199:
URL: https://github.com/apache/echarts/issues/18199
### What problem does this feature solve?
No bug, no feature. Just something I see on console (Chrome 109):
> Canvas2D: Multiple readback operations using getImageData are faster with
the
infacto opened a new issue, #18198:
URL: https://github.com/apache/echarts/issues/18198
### What problem does this feature solve?
Currently you can only pass the theme name to the init method.
### What does the proposed API look like?
It would be great if we have a
helgasoft commented on issue #18194:
URL: https://github.com/apache/echarts/issues/18194#issuecomment-1398046982
there is an [**id**
property](https://echarts.apache.org/en/option.html#series-gauge.id), but even
if set, it does not show up anywhere apparently ... (?!)
--
This is an
helgasoft commented on issue #18196:
URL: https://github.com/apache/echarts/issues/18196#issuecomment-1398026160
Observations are correct, but an easy fix is to just set **bold.color** to
_'red'_ instead of relying on inheritance.
--
This is an automated message from the Apache Git
helgasoft opened a new issue, #18197:
URL: https://github.com/apache/echarts/issues/18197
### Version
5.4.1
### Link to Minimal Reproduction
[all
Skuperday commented on issue #17858:
URL: https://github.com/apache/echarts/issues/17858#issuecomment-1397902071
Hello there! I ran into a same trouble a couple of days ago and found a
solution how to use a bar chart and line chart so that the filtering does not
cut off the data. This
juliepagano opened a new issue, #18196:
URL: https://github.com/apache/echarts/issues/18196
### Version
5.4.1
### Link to Minimal Reproduction
https://codepen.io/juliepagano_cs/pen/XWBzLaJ
### Steps to Reproduce
1. Open [the
github-actions[bot] closed issue #13959: 引力导图中设置的roam:true,开启鼠标平移,怎么监听这个平移事件
URL: https://github.com/apache/echarts/issues/13959
--
This is an automated message from the Apache Git Service.
To respond to the message, please log on to GitHub and use the
URL above to go to the specific comment.
github-actions[bot] commented on issue #13959:
URL: https://github.com/apache/echarts/issues/13959#issuecomment-1397609306
This issue has been automatically closed because it did not have recent
activity. If this remains to be a problem with the latest version of Apache
ECharts, please
github-actions[bot] closed issue #14019: map geo is not realy width
URL: https://github.com/apache/echarts/issues/14019
--
This is an automated message from the Apache Git Service.
To respond to the message, please log on to GitHub and use the
URL above to go to the specific comment.
To
github-actions[bot] commented on issue #14063:
URL: https://github.com/apache/echarts/issues/14063#issuecomment-1397609502
This issue has been automatically marked as stale because it did not have
recent activity. It will be closed in 7 days if no further activity occurs. If
you wish not
github-actions[bot] commented on issue #14075:
URL: https://github.com/apache/echarts/issues/14075#issuecomment-1397609545
This issue has been automatically marked as stale because it did not have
recent activity. It will be closed in 7 days if no further activity occurs. If
you wish not
github-actions[bot] commented on issue #14019:
URL: https://github.com/apache/echarts/issues/14019#issuecomment-1397609382
This issue has been automatically closed because it did not have recent
activity. If this remains to be a problem with the latest version of Apache
ECharts, please
github-actions[bot] commented on issue #13985:
URL: https://github.com/apache/echarts/issues/13985#issuecomment-1397609340
This issue has been automatically marked as stale because it did not have
recent activity. It will be closed in 7 days if no further activity occurs. If
you wish not
github-actions[bot] closed issue #13857: 多折线图缓存和数据合并问题
URL: https://github.com/apache/echarts/issues/13857
--
This is an automated message from the Apache Git Service.
To respond to the message, please log on to GitHub and use the
URL above to go to the specific comment.
To unsubscribe,
github-actions[bot] commented on issue #13857:
URL: https://github.com/apache/echarts/issues/13857#issuecomment-1397609223
This issue has been automatically closed because it did not have recent
activity. If this remains to be a problem with the latest version of Apache
ECharts, please
github-actions[bot] commented on issue #12588:
URL: https://github.com/apache/echarts/issues/12588#issuecomment-1397609111
This issue has been automatically marked as stale because it did not have
recent activity. It will be closed in 7 days if no further activity occurs. If
you wish not
github-actions[bot] closed issue #5888:
在vue中使用echarts,在tooltip中的formatter使用自定义html无法绑定组件内函数作为事件
URL: https://github.com/apache/echarts/issues/5888
--
This is an automated message from the Apache Git Service.
To respond to the message, please log on to GitHub and use the
URL above to go to
echarts-bot[bot] commented on issue #18192:
URL: https://github.com/apache/echarts/issues/18192#issuecomment-1397046866
@minren118 It seems you are not using English, I've helped translate the
content automatically. To make your issue understood by more people and get
helped, we'd like to
minren118 opened a new issue, #18192:
URL: https://github.com/apache/echarts/issues/18192
### Version
5.3
### Link to Minimal Reproduction
_No response_
### Steps to Reproduce
当使用getDataURL对图表进行svg文本输出时,发现ECharts没有对特殊的符号如<进行转义再输出,导致导出的svg文本出错。
jatin-caizin commented on issue #12513:
URL: https://github.com/apache/echarts/issues/12513#issuecomment-1396884985
Can we add custom data to bar and line chart legend irrespective of series
object?
--
This is an automated message from the Apache Git Service.
To respond to the
spoojaj opened a new issue, #18191:
URL: https://github.com/apache/echarts/issues/18191
### What problem does this feature solve?
Get different color for each brush area like given in the example below -
echarts-bot[bot] closed issue #18190: [Feature]
URL: https://github.com/apache/echarts/issues/18190
--
This is an automated message from the Apache Git Service.
To respond to the message, please log on to GitHub and use the
URL above to go to the specific comment.
To unsubscribe, e-mail:
ReactRitik opened a new issue, #18190:
URL: https://github.com/apache/echarts/issues/18190
### What problem does this feature solve?
how to create left and right branch in same tree
### What does the proposed API look like?
![Screenshot
fyzhu commented on issue #17763:
URL: https://github.com/apache/echarts/issues/17763#issuecomment-1396665994
1. radar don't have option of alignTicks,but align radar's tick in code
2. haven't check alignTicks' value before alignScaleTicks
--
This is an automated message from
arundeep78 opened a new issue, #18189:
URL: https://github.com/apache/echarts/issues/18189
### What problem does this feature solve?
Add a possibility to configure theme settings for graphic elements e.g. text
or rectangle etc.
We use graphic elements to [add our Logo and
OrcVole opened a new issue, #18188:
URL: https://github.com/apache/echarts/issues/18188
### What problem does this feature solve?
The "Lines" section does not have any tools to help indicate sequence of
events in a chronology. Understanding the correct order of events is
fundamental
frntline-dev commented on issue #12923:
URL: https://github.com/apache/echarts/issues/12923#issuecomment-1396101331
Any update on this?
--
This is an automated message from the Apache Git Service.
To respond to the message, please log on to GitHub and use the
URL above to go to the
github-actions[bot] commented on issue #13827:
URL: https://github.com/apache/echarts/issues/13827#issuecomment-1396085809
This issue has been automatically marked as stale because it did not have
recent activity. It will be closed in 7 days if no further activity occurs. If
you wish not
github-actions[bot] commented on issue #14060:
URL: https://github.com/apache/echarts/issues/14060#issuecomment-1396086005
This issue has been automatically marked as stale because it did not have
recent activity. It will be closed in 7 days if no further activity occurs. If
you wish not
github-actions[bot] closed issue #13993: echarts-gl 移动端无法响应click事件
URL: https://github.com/apache/echarts/issues/13993
--
This is an automated message from the Apache Git Service.
To respond to the message, please log on to GitHub and use the
URL above to go to the specific comment.
To
github-actions[bot] commented on issue #14045:
URL: https://github.com/apache/echarts/issues/14045#issuecomment-1396085944
This issue has been automatically marked as stale because it did not have
recent activity. It will be closed in 7 days if no further activity occurs. If
you wish not
github-actions[bot] commented on issue #11997:
URL: https://github.com/apache/echarts/issues/11997#issuecomment-1396085722
This issue has been automatically closed because it did not have recent
activity. If this remains to be a problem with the latest version of Apache
ECharts, please
github-actions[bot] commented on issue #13993:
URL: https://github.com/apache/echarts/issues/13993#issuecomment-1396085872
This issue has been automatically closed because it did not have recent
activity. If this remains to be a problem with the latest version of Apache
ECharts, please
github-actions[bot] closed issue #11997: Support for monthly time axis labels
URL: https://github.com/apache/echarts/issues/11997
--
This is an automated message from the Apache Git Service.
To respond to the message, please log on to GitHub and use the
URL above to go to the specific
nico-robert commented on issue #18185:
URL: https://github.com/apache/echarts/issues/18185#issuecomment-1387421042
okay @Ovilia, It was just to show the difference between 2 versions of
Echarts. For me (personal opinion) the result in version 5.2.1 is correct ,
because the borderColor does
gzhong88 commented on issue #18175:
URL: https://github.com/apache/echarts/issues/18175#issuecomment-1387314707
Above Heatmpa_issue.pptx contains a recorded video which shows how the issue
can be reproduced.
Just click at Heatmpa_issue.pptx link to download and open it, then click at
gzhong88 commented on issue #18175:
URL: https://github.com/apache/echarts/issues/18175#issuecomment-1387277986
[Heatmap_issue.pptx](https://github.com/apache/echarts/files/10448131/Heatmap_issue.pptx)
--
This is an automated message from the Apache Git Service.
To respond to the
ousmorez commented on issue #18147:
URL: https://github.com/apache/echarts/issues/18147#issuecomment-1387042675
@Ovilia I tried to resize the chart before starting the print process using
the following code:
```javascript
var mediaQueryList = window.matchMedia('print');
Ovilia commented on issue #18183:
URL: https://github.com/apache/echarts/issues/18183#issuecomment-1386741388
Please add more information. I'm not sure what you mean.
--
This is an automated message from the Apache Git Service.
To respond to the message, please log on to GitHub and use
Ovilia commented on issue #18185:
URL: https://github.com/apache/echarts/issues/18185#issuecomment-1386681173
The current behavior seems to be reasonable. As for the candlestick series,
we are considering provide a way to dynamically change the range of data one
bar represents so that
echarts-bot[bot] commented on issue #18187:
URL: https://github.com/apache/echarts/issues/18187#issuecomment-1386678649
@windinging Please provide a demo for the issue either with [Official
Editor](https://echarts.apache.org/examples/editor.html),
Ovilia commented on issue #18181:
URL: https://github.com/apache/echarts/issues/18181#issuecomment-1386677448
如 @zhonghuaifang 所说,如果有这类定制 max 的需求,需要自己通过 max 指定,可以通过数据动态计算后设置
--
This is an automated message from the Apache Git Service.
To respond to the message, please log on to GitHub
Malachite40 commented on issue #16693:
URL: https://github.com/apache/echarts/issues/16693#issuecomment-1386599150
I'm also having this issue still
--
This is an automated message from the Apache Git Service.
To respond to the message, please log on to GitHub and use the
URL above to go
windinging commented on issue #18187:
URL: https://github.com/apache/echarts/issues/18187#issuecomment-1386412152
--
This is an automated message from the Apache Git
windinging opened a new issue, #18187:
URL: https://github.com/apache/echarts/issues/18187
### Version
5.4.1
### Link to Minimal Reproduction
_No response_
### Steps to Reproduce
```
{
type: 'graph',
layout: 'force',
echarts-bot[bot] closed issue #18186: [Bug]
URL: https://github.com/apache/echarts/issues/18186
--
This is an automated message from the Apache Git Service.
To respond to the message, please log on to GitHub and use the
URL above to go to the specific comment.
To unsubscribe, e-mail:
windinging opened a new issue, #18186:
URL: https://github.com/apache/echarts/issues/18186
### Version
5.4.1
### Link to Minimal Reproduction
_No response_
### Steps to Reproduce
```
{
type: 'graph',
layout: 'force',
echarts-bot[bot] closed issue #18178: [Feature] markpoint data zlevel or z
URL: https://github.com/apache/echarts/issues/18178
--
This is an automated message from the Apache Git Service.
To respond to the message, please log on to GitHub and use the
URL above to go to the specific comment.
Ovilia commented on issue #18178:
URL: https://github.com/apache/echarts/issues/18178#issuecomment-1386384152
Please follow #15494
--
This is an automated message from the Apache Git Service.
To respond to the message, please log on to GitHub and use the
URL above to go to the specific
Ovilia closed issue #18178: [Feature] markpoint data zlevel or z
URL: https://github.com/apache/echarts/issues/18178
--
This is an automated message from the Apache Git Service.
To respond to the message, please log on to GitHub and use the
URL above to go to the specific comment.
To
Ovilia commented on issue #18175:
URL: https://github.com/apache/echarts/issues/18175#issuecomment-1386383202
Cannot reproduce even with mouse hoving Run button.
--
This is an automated message from the Apache Git Service.
To respond to the message, please log on to GitHub and use the
URL
linwrui commented on issue #18177:
URL: https://github.com/apache/echarts/issues/18177#issuecomment-1386341993
> Where is the _blank data_? Shouldn't it be `data: [null, null, null, null,
null, ..., 218, 135, 147, 260].map((o, index) => [index, o])` But even then it
all depends on
linwrui commented on issue #18177:
URL: https://github.com/apache/echarts/issues/18177#issuecomment-1386340528
> Where is the _blank data_? Shouldn't it be `data: [null, null, null, null,
null, ..., 218, 135, 147, 260].map((o, index) => [index, o])` But even then it
all depends on
github-actions[bot] commented on issue #14047:
URL: https://github.com/apache/echarts/issues/14047#issuecomment-1386048670
This issue has been automatically marked as stale because it did not have
recent activity. It will be closed in 7 days if no further activity occurs. If
you wish not
github-actions[bot] commented on issue #14052:
URL: https://github.com/apache/echarts/issues/14052#issuecomment-1386048699
This issue has been automatically marked as stale because it did not have
recent activity. It will be closed in 7 days if no further activity occurs. If
you wish not
nico-robert opened a new issue, #18185:
URL: https://github.com/apache/echarts/issues/18185
### Version
5.4.1
### Link to Minimal Reproduction
_No response_
### Steps to Reproduce
I don't know if in version 5.2.1 It was the good result , but when I add
iamsee closed issue #18184: [Bug] A special line will appear when bar and
pictorialBar are used together
URL: https://github.com/apache/echarts/issues/18184
--
This is an automated message from the Apache Git Service.
To respond to the message, please log on to GitHub and use the
URL above
echarts-bot[bot] commented on issue #18184:
URL: https://github.com/apache/echarts/issues/18184#issuecomment-1385700859
@iamsee It seems you are not using English, I've helped translate the
content automatically. To make your issue understood by more people and get
helped, we'd like to
iamsee opened a new issue, #18184:
URL: https://github.com/apache/echarts/issues/18184
### Version
5.4.1
### Link to Minimal Reproduction
_No response_
### Steps to Reproduce
Jordi-LG commented on issue #16709:
URL: https://github.com/apache/echarts/issues/16709#issuecomment-1385557124
Hi, any updates for the issue ? I'm also stuck and got this error when i
tried to compil my app.
`import * as echarts from 'echarts'` with echarts 5.4.1
```
plainheart commented on issue #18180:
URL: https://github.com/apache/echarts/issues/18180#issuecomment-1385490105
This is up to the limit of the browser, and it's not related to ECharts.
--
This is an automated message from the Apache Git Service.
To respond to the message, please log on
plainheart closed issue #18180: [Bug] Height Exceeds 65535px Error
URL: https://github.com/apache/echarts/issues/18180
--
This is an automated message from the Apache Git Service.
To respond to the message, please log on to GitHub and use the
URL above to go to the specific comment.
To
wqzwh commented on issue #18181:
URL: https://github.com/apache/echarts/issues/18181#issuecomment-1385184705
https://user-images.githubusercontent.com/16662470/212876240-a7556c27-896a-4a3b-802d-b56dd53959c7.png;>
zhonghuaifang commented on issue #18181:
URL: https://github.com/apache/echarts/issues/18181#issuecomment-1385047963
@wqzwh [https://echarts.apache.org/zh/option.html#yAxis.max](url)
--
This is an automated message from the Apache Git Service.
To respond to the message, please log on to
echarts-bot[bot] commented on issue #18183:
URL: https://github.com/apache/echarts/issues/18183#issuecomment-1385015179
@zhonghuaifang It seems you are not using English, I've helped translate the
content automatically. To make your issue understood by more people and get
helped, we'd like
zhonghuaifang opened a new issue, #18183:
URL: https://github.com/apache/echarts/issues/18183
### What problem does this feature solve?
xAxis.axisLabel.formatter 的`分级模板`能加入按季度分级吗
### What does the proposed API look like?
zhonghuaifang opened a new issue, #18182:
URL: https://github.com/apache/echarts/issues/18182
### What problem does this feature solve?
xAxis.axisLabel.formatter 的`分级模板`能加入`quarter`按季度吗
### What does the proposed API look like?
echarts-bot[bot] closed issue #18182: [Feature]
URL: https://github.com/apache/echarts/issues/18182
--
This is an automated message from the Apache Git Service.
To respond to the message, please log on to GitHub and use the
URL above to go to the specific comment.
To unsubscribe, e-mail:
wqzwh commented on issue #18181:
URL: https://github.com/apache/echarts/issues/18181#issuecomment-1385000755
这是我期望的效果,不至于线贴在顶部。
https://user-images.githubusercontent.com/16662470/212844413-95b72ed0-2a63-474c-9519-55e69ad397d6.png;>
--
This is an automated message from the Apache
helgasoft commented on issue #18181:
URL: https://github.com/apache/echarts/issues/18181#issuecomment-1384980562
Use _grid.height_ and _yAxis.interval_ for better looking chart - [Demo
Ovilia merged PR #86:
URL: https://github.com/apache/echarts-handbook/pull/86
--
This is an automated message from the Apache Git Service.
To respond to the message, please log on to GitHub and use the
URL above to go to the specific comment.
To unsubscribe, e-mail:
helgasoft commented on issue #18177:
URL: https://github.com/apache/echarts/issues/18177#issuecomment-1384955590
Where is the _blank data_? Shouldn't it be
```data: [null, null, null, null, null, ..., 218, 135, 147, 260].map((o,
index) => [index, o])```
But even then it all depends
echarts-bot[bot] commented on issue #18181:
URL: https://github.com/apache/echarts/issues/18181#issuecomment-1384948962
@wqzwh It seems you are not using English, I've helped translate the content
automatically. To make your issue understood by more people and get helped,
we'd like to
wqzwh opened a new issue, #18181:
URL: https://github.com/apache/echarts/issues/18181
### Version
5.4.1
### Link to Minimal Reproduction
_No response_
### Steps to Reproduce
```
option = {
xAxis: {
type: 'category',
data: ['Mon',
biscuit214 opened a new issue, #18180:
URL: https://github.com/apache/echarts/issues/18180
### Version
5.4.1
### Link to Minimal Reproduction
https://codesandbox.io/s/basic-bar-forked-74z08m?file=/style.css
### Steps to Reproduce
1.Use the following link to
kubichengxuyuan opened a new issue, #18179:
URL: https://github.com/apache/echarts/issues/18179
### Version
5.3.0
### Link to Minimal Reproduction
_No response_
### Steps to Reproduce
1. normal create
2. toolBox
### Current Behavior
click
cqcpcqp commented on issue #6928:
URL: https://github.com/apache/echarts/issues/6928#issuecomment-1384884511
iscroll 5.2.0
--
This is an automated message from the Apache Git Service.
To respond to the message, please log on to GitHub and use the
URL above to go to the specific comment.
Ovilia opened a new pull request, #86:
URL: https://github.com/apache/echarts-handbook/pull/86
Add the document for the ssr+csr solution.
I changed the original title `Server-Side String-based SVG Rendering` to
`Server-Side SVG Rendering` to make it more symmetry with Canvas. I think
gzhong88 commented on issue #18175:
URL: https://github.com/apache/echarts/issues/18175#issuecomment-1384770779
--
This is an automated message from the Apache Git
gzhong88 commented on issue #18175:
URL: https://github.com/apache/echarts/issues/18175#issuecomment-1384767314
To reproduce the problem, after you replaced the line 11 code in above step2
with the following code, then click on Run button. Let your mouse cursor stay
focused on the Run
gzhong88 commented on issue #18175:
URL: https://github.com/apache/echarts/issues/18175#issuecomment-1384766409
To reproduce the problem, after you replaced the line 11 code in above step2
with the following code, then click on Run button. Let your mouse cursor stay
focused on the Run
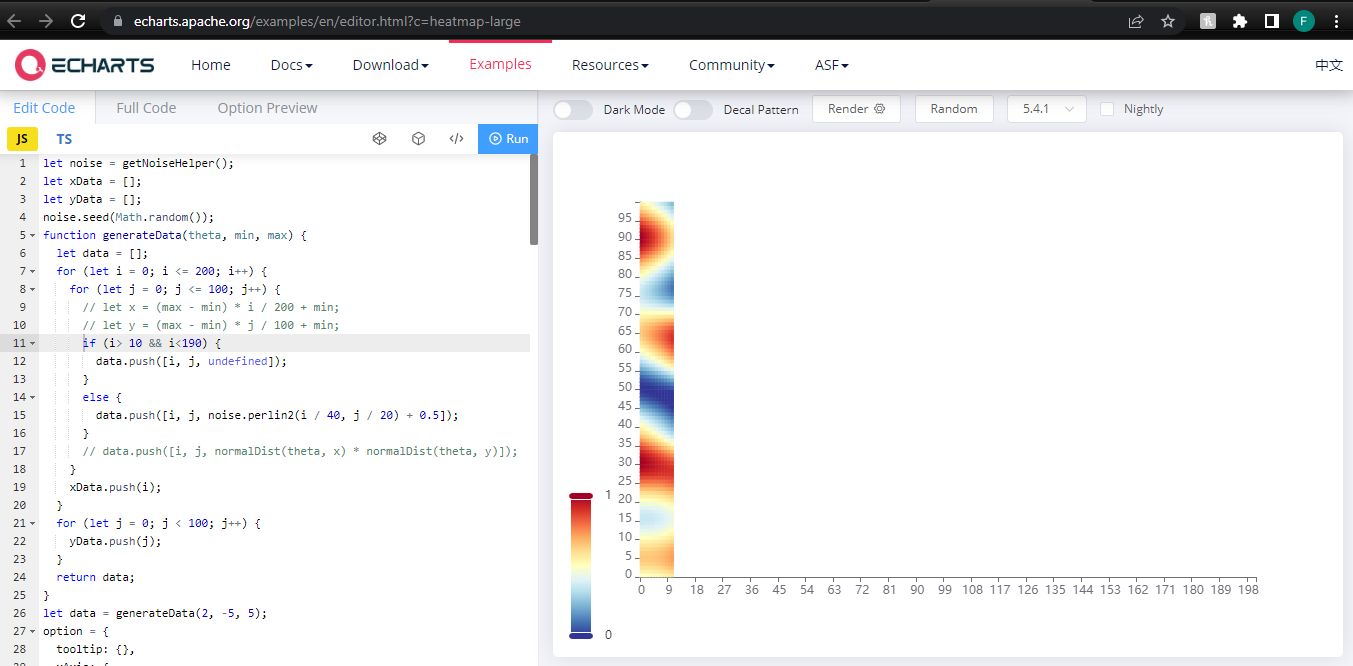
gzhong88 commented on issue #18175:
URL: https://github.com/apache/echarts/issues/18175#issuecomment-1384567865
1. Use the following link to create the
heatmap:https://echarts.apache.org/examples/en/editor.html?c=heatmap-large
2. Replacing line 11 in function generateData(theta, min,
gzhong88 commented on issue #18175:
URL: https://github.com/apache/echarts/issues/18175#issuecomment-1384515909
If you cannot reproduce, try to set the no data gap bigger by changing i
<160 to i<190 as following, and try again. Thanks.
Replacing line 11 in function generateData(theta,
gzhong88 commented on issue #18175:
URL: https://github.com/apache/echarts/issues/18175#issuecomment-1384513944
-
If you cannot reproduce, try to set the no data gap bigger by changing i
<160 to i<190 as following, and try again. Thanks.
-
Use the
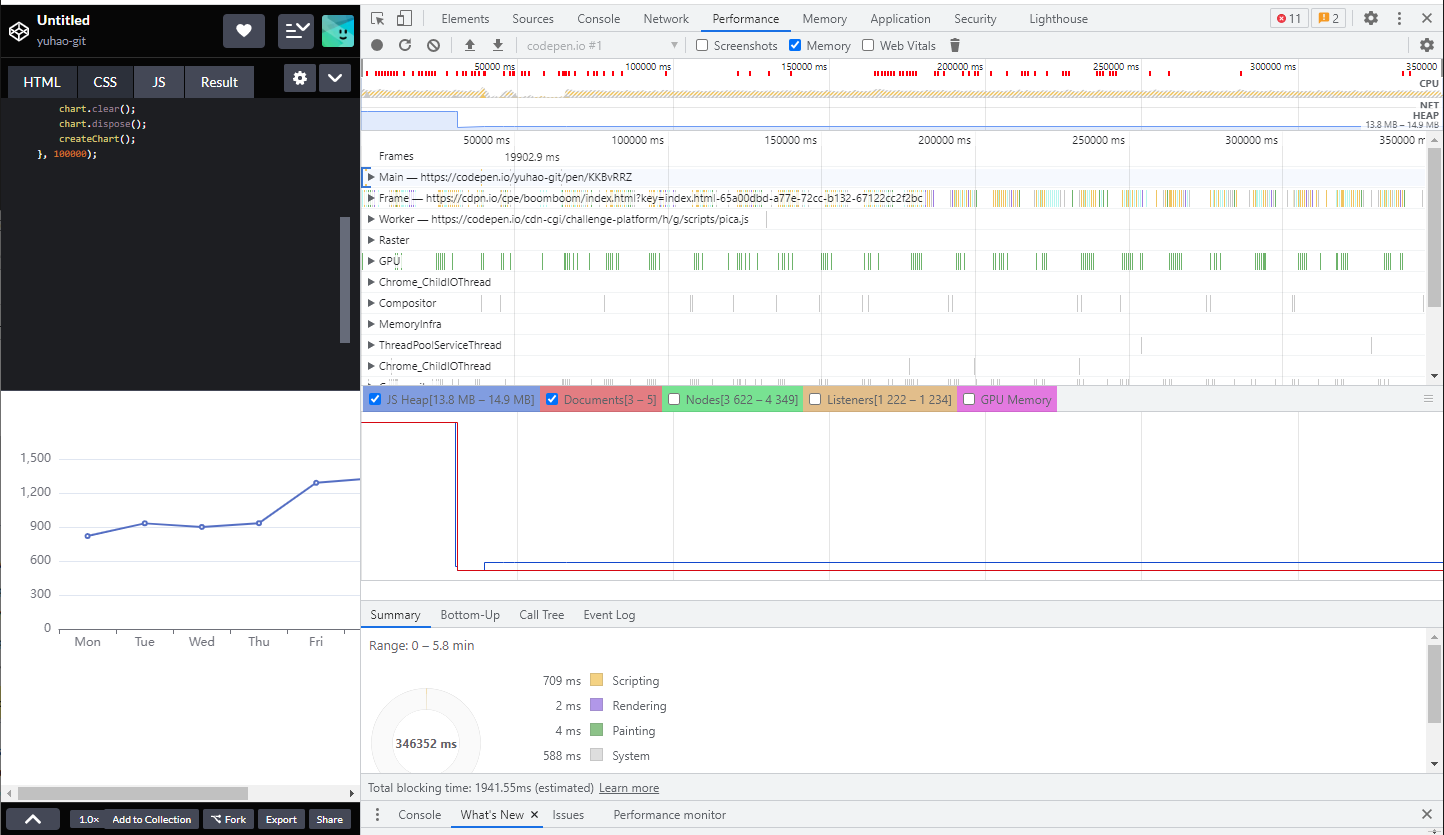
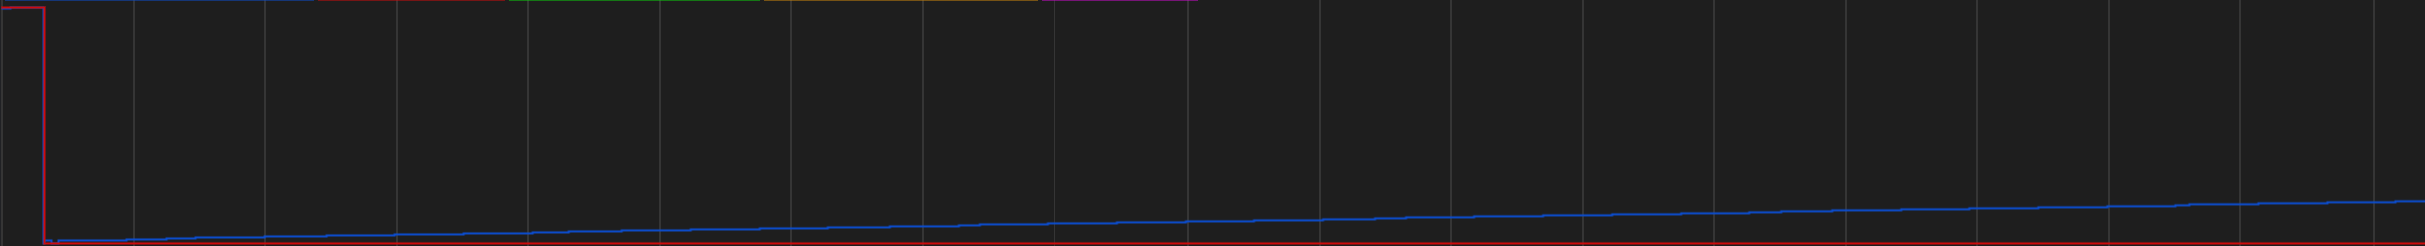
helgasoft commented on issue #18162:
URL: https://github.com/apache/echarts/issues/18162#issuecomment-1384477690
could not reproduce, my JS Heap is lifelessly flat.
JohnKu2020 commented on issue #5418:
URL: https://github.com/apache/echarts/issues/5418#issuecomment-1383977735
I have the same problem. Is there correct solution?
--
This is an automated message from the Apache Git Service.
To respond to the message, please log on to GitHub and use the
zwygithub opened a new issue, #18178:
URL: https://github.com/apache/echarts/issues/18178
### What problem does this feature solve?
in markpoint data zlevel or z
### What does the proposed API look like?
markpoint data zlevel or z
--
This is an automated message from
Ovilia closed issue #18172: [Feature] pie with 2 dimensions
URL: https://github.com/apache/echarts/issues/18172
--
This is an automated message from the Apache Git Service.
To respond to the message, please log on to GitHub and use the
URL above to go to the specific comment.
To unsubscribe,
Ovilia commented on issue #18172:
URL: https://github.com/apache/echarts/issues/18172#issuecomment-1383697790
If you must have this feature, you can consider fork the repo and make
changes.
--
This is an automated message from the Apache Git Service.
To respond to the message, please log
linwrui opened a new issue, #18177:
URL: https://github.com/apache/echarts/issues/18177
### Version
5.4.1
### Link to Minimal Reproduction
_No response_
### Steps to Reproduce
You can reproduce at official demo editor with options like
```js
option =
slindersAmsterdam commented on issue #18172:
URL: https://github.com/apache/echarts/issues/18172#issuecomment-1383685633
I have very smart users who can handle some extra information. :) . If it's
not possible in Echarts to handle two dimensions on a pie chart (angle and
radius) then I
sclydon commented on issue #13759:
URL: https://github.com/apache/echarts/issues/13759#issuecomment-1383676852
I need this feature as well.
--
This is an automated message from the Apache Git Service.
To respond to the message, please log on to GitHub and use the
URL above to go to the
zqq-7 commented on issue #14973:
URL: https://github.com/apache/echarts/issues/14973#issuecomment-1383639079
May I ask how it was finally resolved?
--
This is an automated message from the Apache Git Service.
To respond to the message, please log on to GitHub and use the
URL above to go
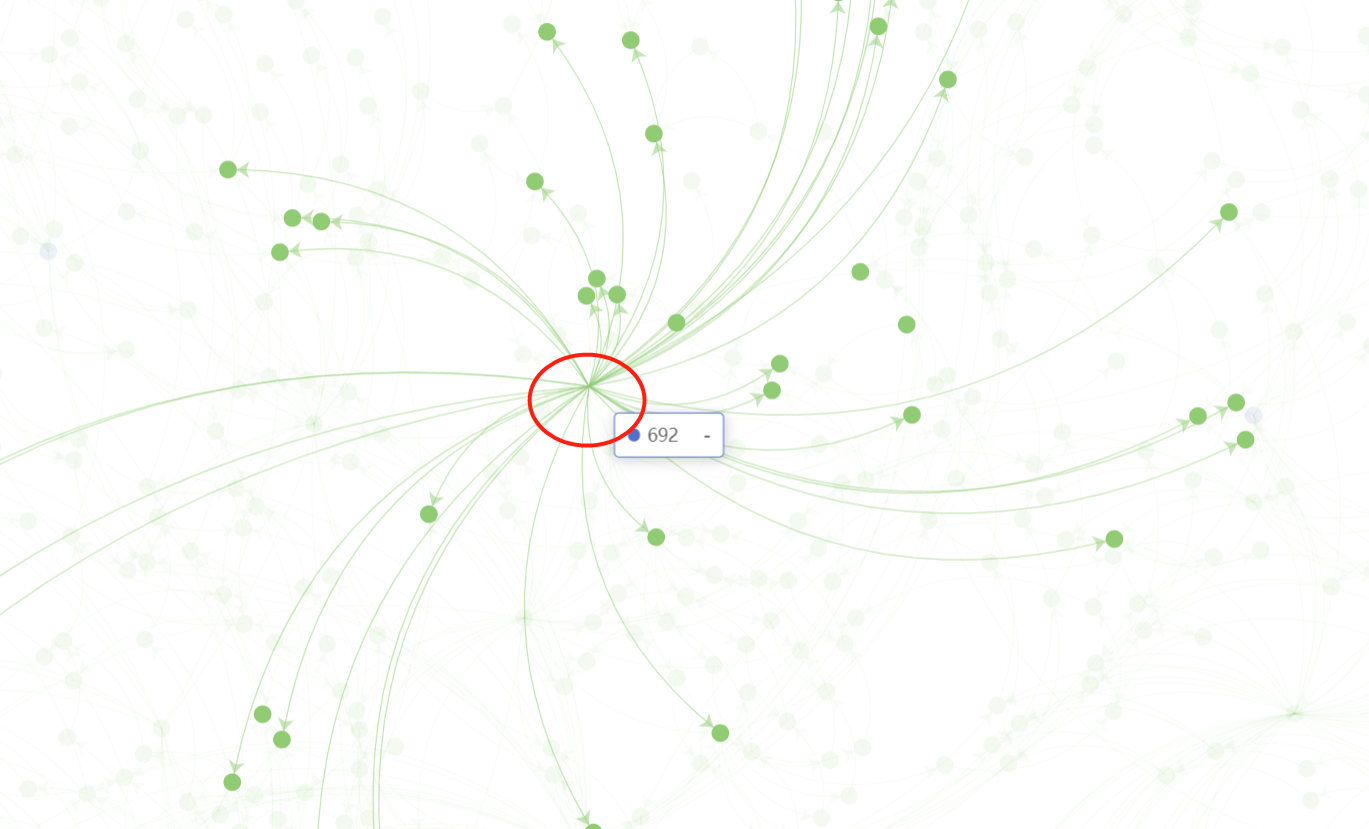
helgasoft commented on issue #18174:
URL: https://github.com/apache/echarts/issues/18174#issuecomment-1383632362
Yes, your observations are correct.
Zooming will separate nodes from links and create a mess.
Clicking on a legend will fix it somewhat, but not 100%.
--
This is an
yuhao-git commented on issue #18162:
URL: https://github.com/apache/echarts/issues/18162#issuecomment-1383619216
@Ovilia https://codepen.io/yuhao-git/pen/KKBvRRZ
--
echarts-bot[bot] commented on issue #18162:
URL: https://github.com/apache/echarts/issues/18162#issuecomment-1383596026
@yuhao-git Please provide a demo for the issue either with [Official
Editor](https://echarts.apache.org/examples/editor.html),
Ovilia commented on issue #18175:
URL: https://github.com/apache/echarts/issues/18175#issuecomment-1383587564
Cannot reproduce.
https://user-images.githubusercontent.com/779050/212618804-49180b66-6540-4ae0-9040-f9bf24baeb0a.png;>
Looks as expected to me.
--
This is an
1 - 100 of 45085 matches
Mail list logo