djanusausk opened a new issue #12871:
URL: https://github.com/apache/incubator-echarts/issues/12871
Hi, There seems to be a limitation on how dataZoom draws the timeline for the clustered charts. Consider following example. Clustered bar chart with the categorical legend. 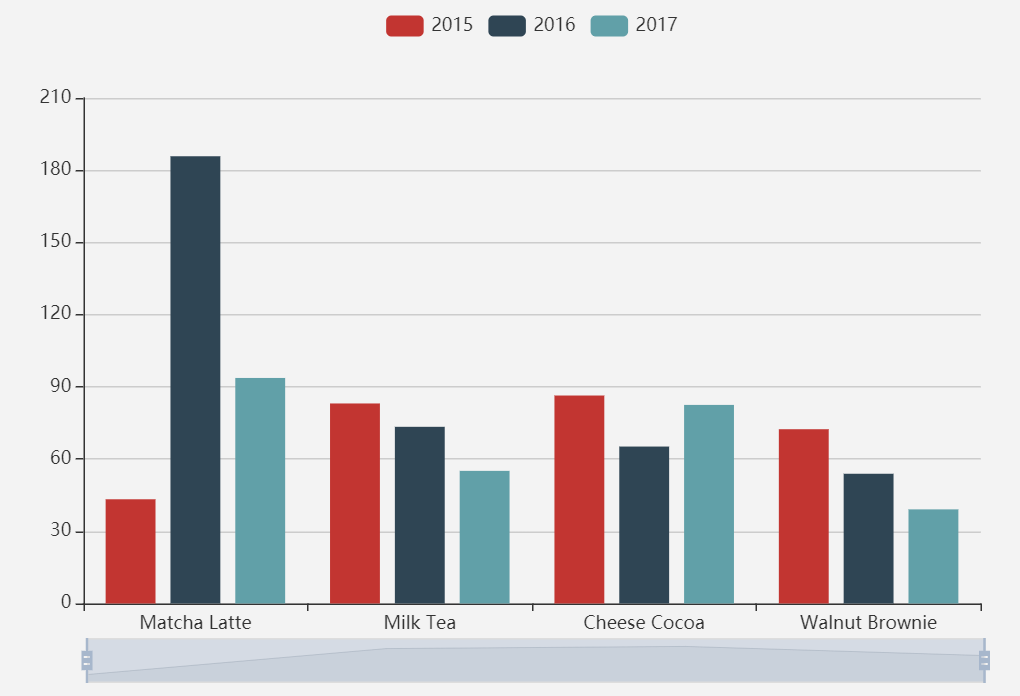 As you can see from the image, "Matcha Latte" has a significant peak on the 2016. However, dataZoom does not correctly indicate this. It seems that dataZoom always draws timeline for the first category which is "2015" in the example above. Instead as a user I would expect that dataZoom displays timeline across the total of the categorical values. It should also respond correctly based on the categories selected/highlighted. I did not come across any configuration option to support above. Could you please advise? Here is the example: option = { legend: {}, tooltip: {}, dataset: { source: [ ['product', '2015', '2016', '2017'], ['Matcha Latte', 43.3, 185.8, 93.7], ['Milk Tea', 83.1, 73.4, 55.1], ['Cheese Cocoa', 86.4, 65.2, 82.5], ['Walnut Brownie', 72.4, 53.9, 39.1] ] }, xAxis: {type: 'category'}, yAxis: {}, // Declare several bar series, each will be mapped // to a column of dataset.source by default. dataZoom: [ { show: true, type: 'slider', start: 0, end: 100, filterMode: 'filter' }, { type: 'inside', start: 0, end: 100 }, { show: false, yAxisIndex: 0, filterMode: 'empty', width: 30, height: '80%', showDataShadow: false, left: '93%' } ], series: [ {type: 'bar'}, {type: 'bar'}, {type: 'bar'} ] }; Thanks in advance, Dee ---------------------------------------------------------------- This is an automated message from the Apache Git Service. To respond to the message, please log on to GitHub and use the URL above to go to the specific comment. For queries about this service, please contact Infrastructure at: us...@infra.apache.org --------------------------------------------------------------------- To unsubscribe, e-mail: commits-unsubscr...@echarts.apache.org For additional commands, e-mail: commits-h...@echarts.apache.org