dagundejuzi commented on issue #11595: 图表区域不能单独滚动。
URL:
https://github.com/apache/incubator-echarts/issues/11595#issuecomment-566395149
> You can use dataZoom and set a min/max value to y axis.
我的XY轴都是分类轴,固定的值,缩放的是x轴。采用这种方式
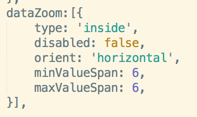
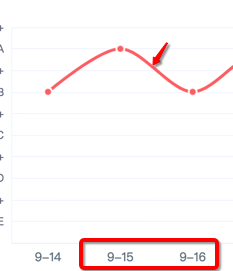
实现了图表内部滚动,且不会缩放的效果。但是有其他问题:1、滑动动画不流畅,手机上会有滑动后的减速滑动效果,echart没有,对比就显得echart滑起来一顿一顿的。数据点在滑完后还有个从小到大的慢速放大动画;滑动是还能看到残影。
2、双指缩放手势,虽然不会导致缩放,但依然响应其中一个手指的滑动,会往前滑或后滑。
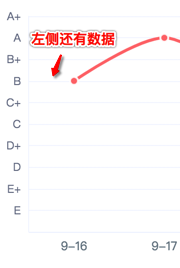
另外,当xAxis的 boundaryGap: true,时,折线在边缘是截断的
[这是一个示例](https://gallery.echartsjs.com/editor.html?c=xDHD5FFyZ&v=1)
This is an automated message from the Apache Git Service.
To respond to the message, please log on to GitHub and use the
URL above to go to the specific comment.
For queries about this service, please contact Infrastructure at:
us...@infra.apache.org
With regards,
Apache Git Services
-
To unsubscribe, e-mail: commits-unsubscr...@echarts.apache.org
For additional commands, e-mail: commits-h...@echarts.apache.org